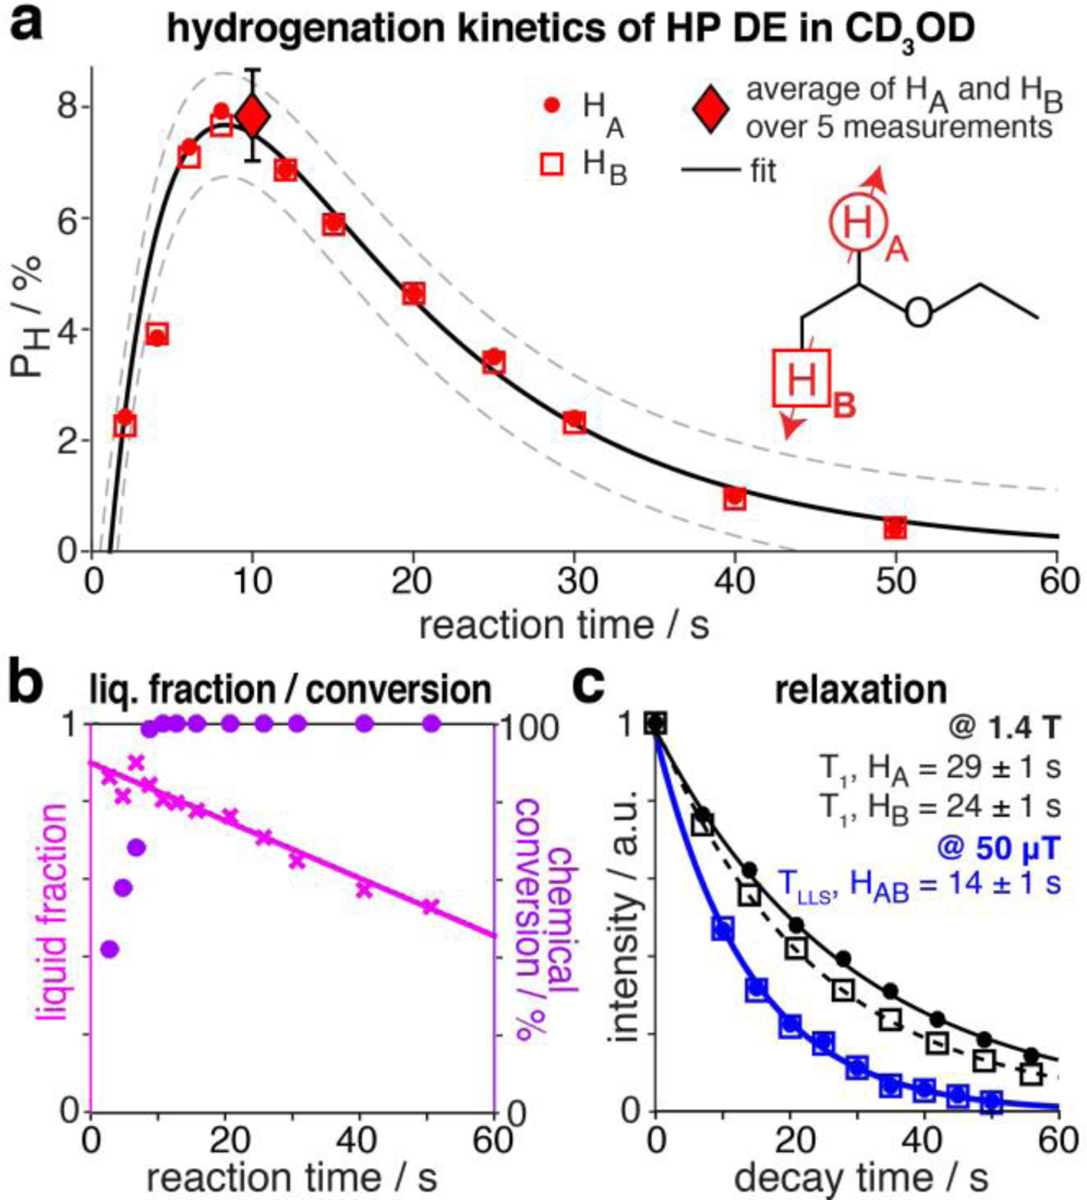
Figure 2.

a) 1H polarization levels of HP DE in CD3OD as a function of reaction time in the Earth’s magnetic field (50 μT). Dashed lines indicate 95% confidence boundaries of the fit b) DE liquid fraction (pink crosses) and chemical conversion (magenta circles) of EVE to DE as a function of reaction time. c) Exponential decays of HP DE NMR signals at 1.4 T (black circles and squares) and 50 μT (blue circles and squares).
