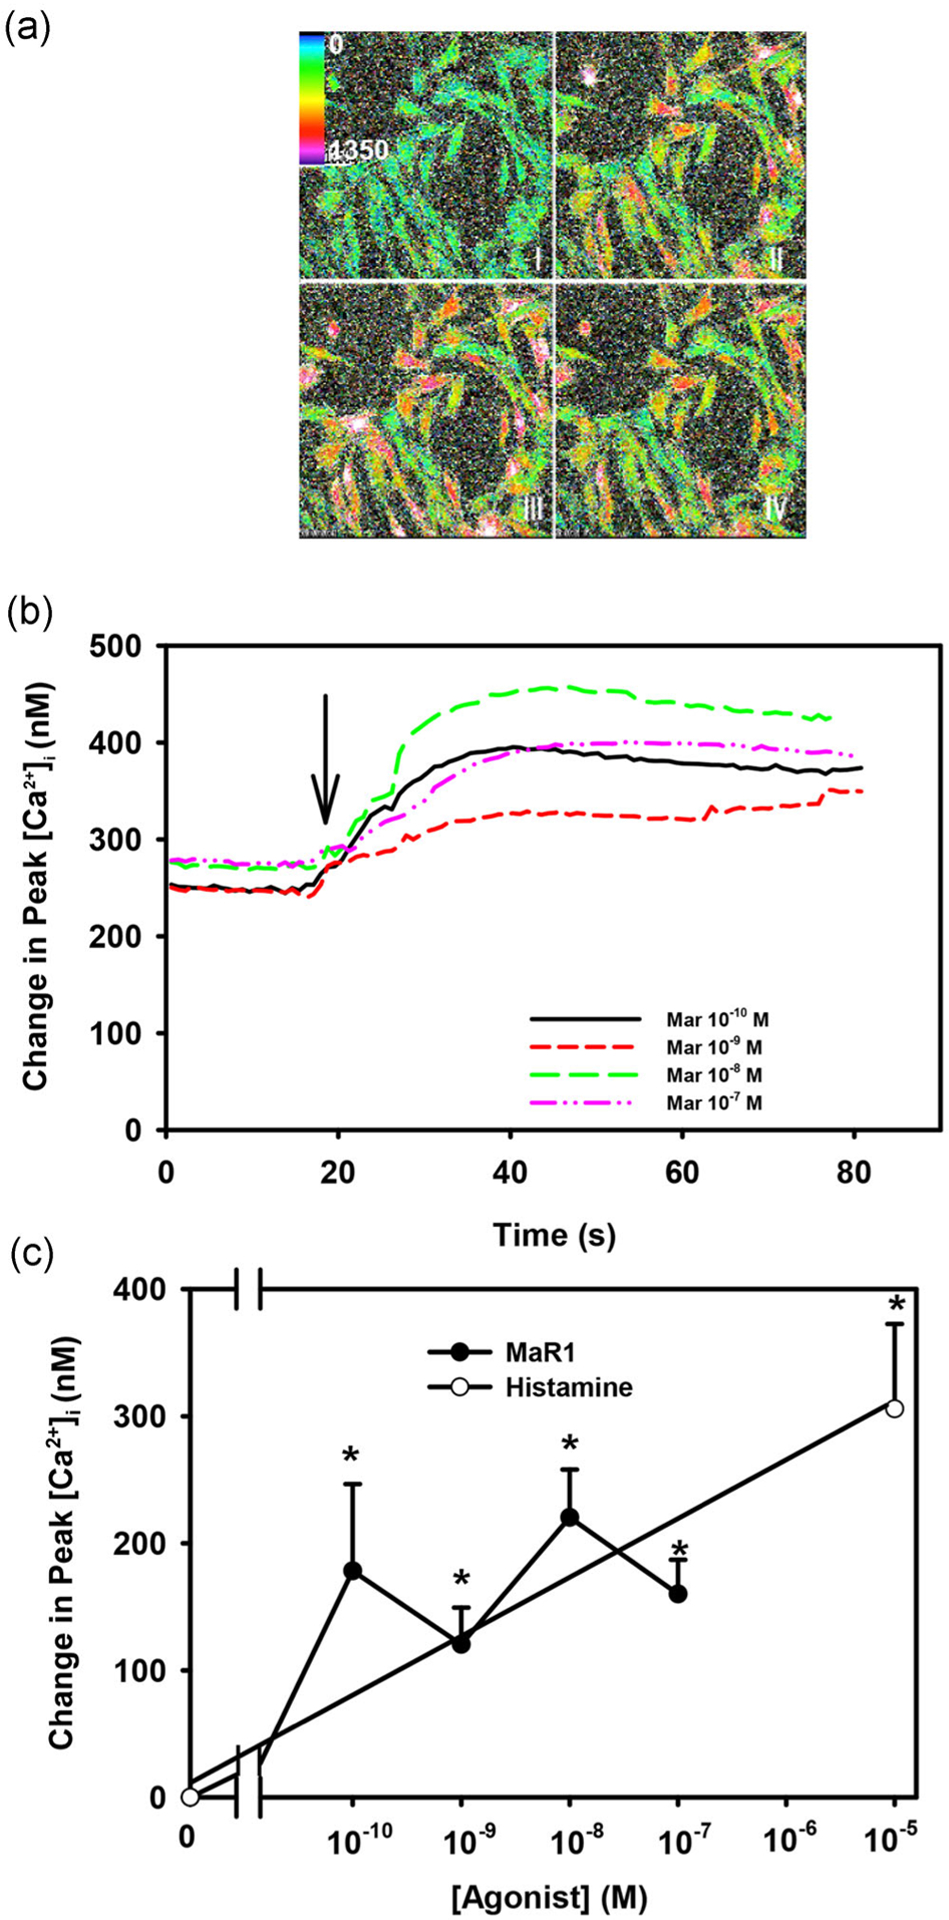
FIGURE 2.

Maresin 1 (MaR1) stimulates an increase in [Ca2+]i. Pseudocolor images of rat conjunctival goblet cells stimulated with MaR1 (10−8 M) (a) at t = 0, 30, 50, and 80 s.Changes in [Ca2+]i over time with different concentrations of MaR1 are shown in (b). Change in peak [Ca2+]i is shown in (c). Data are mean ± SEM from six experiments. *Significance above basal. Arrow indicates addition of MaR1. [Ca2+]i, intracellular Ca2+; SEM, standard error of the mean
