Figure 2.

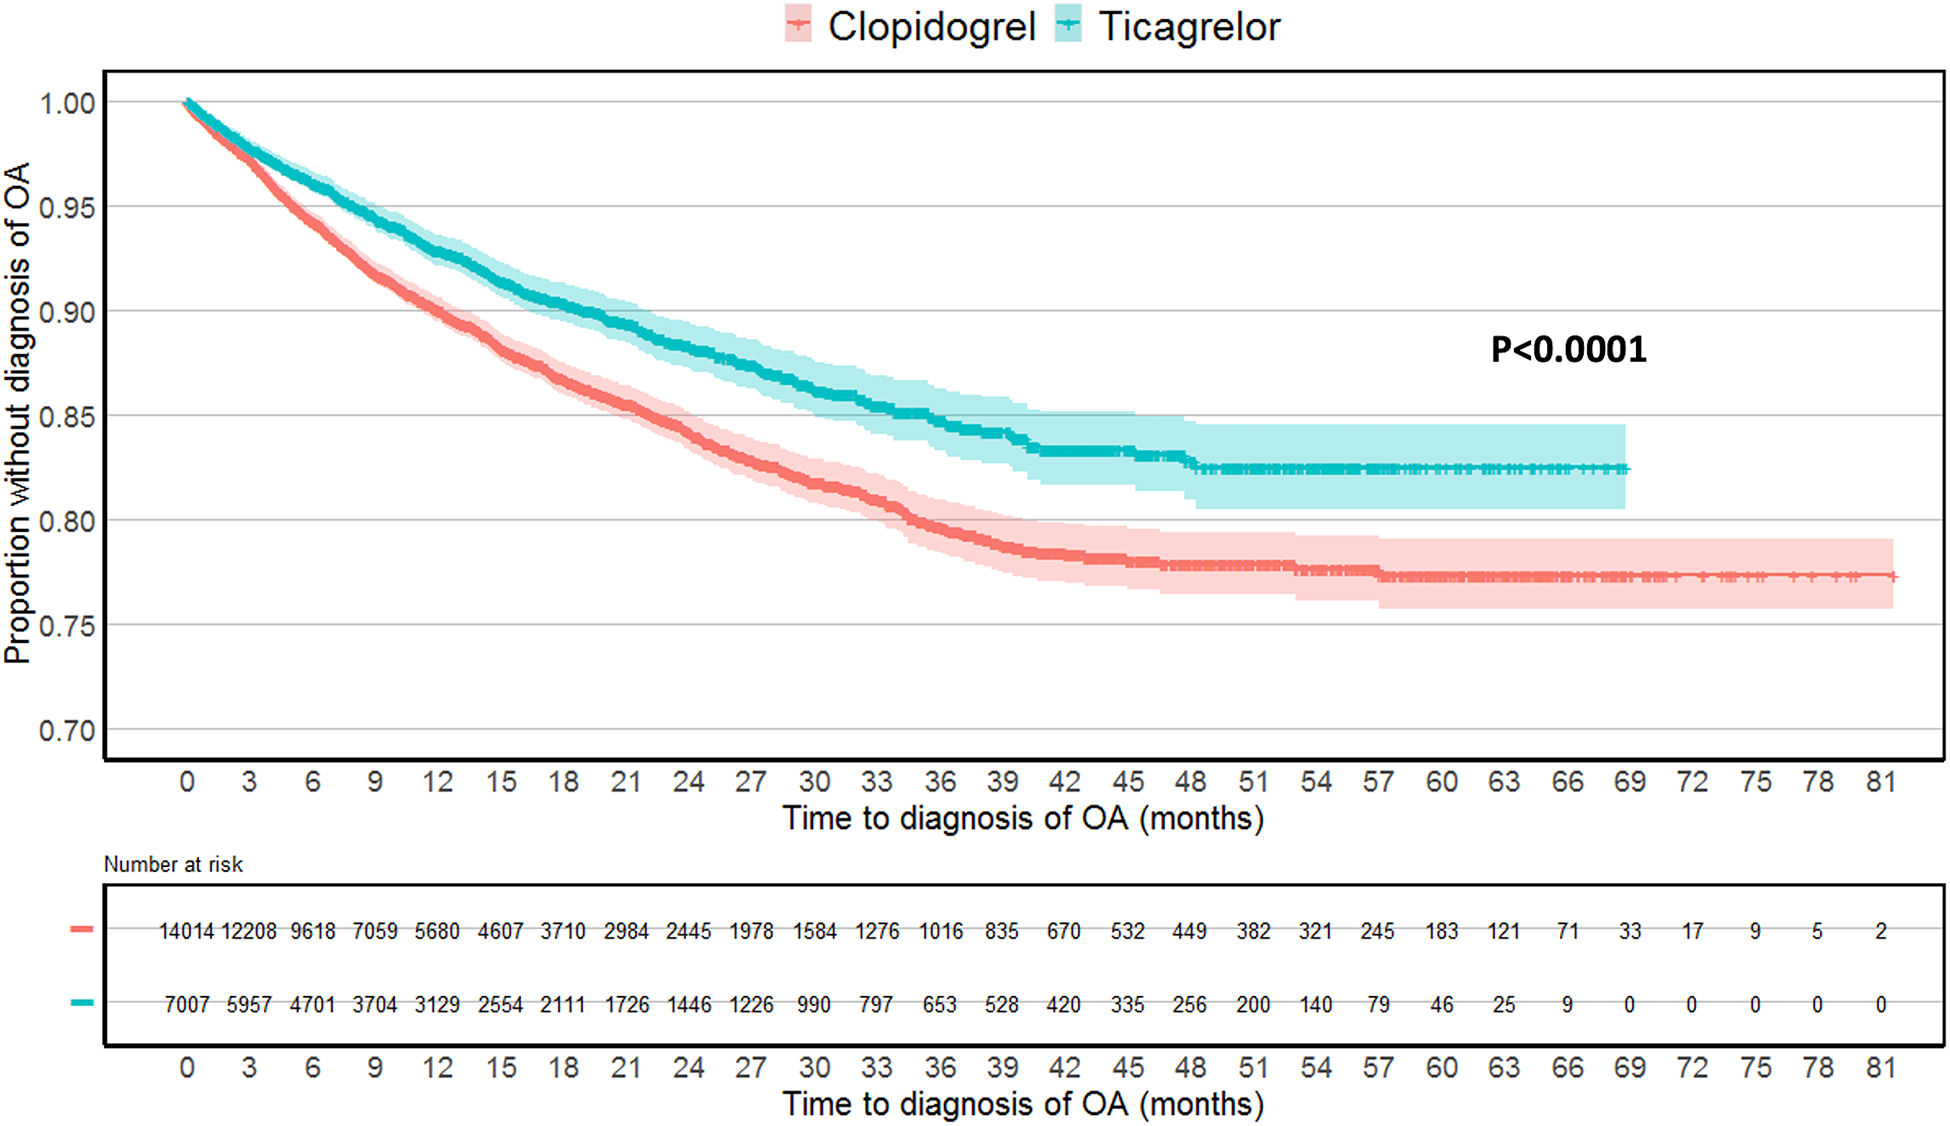
Kaplan-Meier plot of time to osteoarthritis diagnosis in the propensity score matched cohorts. Log-rank test was used to compare the two survival distributions.

Kaplan-Meier plot of time to osteoarthritis diagnosis in the propensity score matched cohorts. Log-rank test was used to compare the two survival distributions.