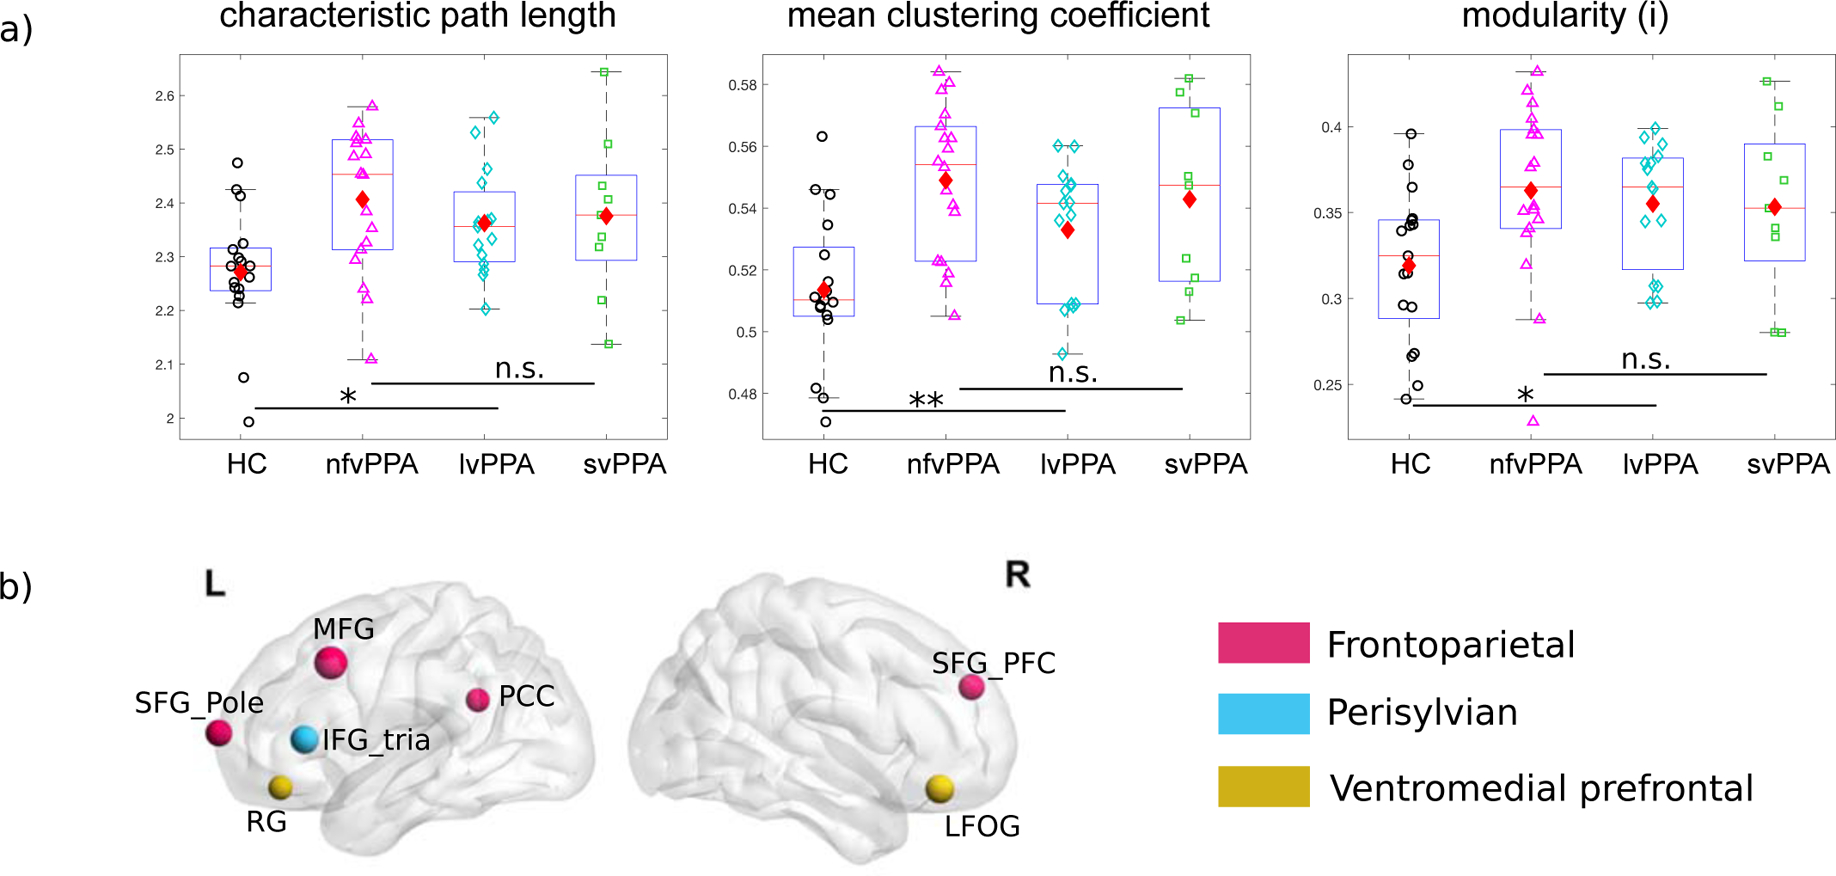
Figure 2. Graph-theoretic measures for which PPA groups exhibited statistically significant differences from the healthy control (HC) group.

a) Left to right: characteristic path length, mean clustering coefficient, and modularity(i), all indicate that the PPA group had greater segregation (or lower integration) than the HC group. No difference was found among the three PPA variants. See Table 2 for results for all graph-theoretic measures evaluated. The boxplots show the lower to upper quartile of the data with a line indicating the median, the diamonds indicate the mean. *: p<0.05; **: p<0.01 Bonferroni corrected. b) ROIs that show higher nodal clustering coefficient in PPA than HC. The node sizes are proportional to the t-values and the colors indicate their module membership as in Supp Fig. 1. The nodes are found in three modules. Note that we color-code the module membership only to facilitate visual inspection and that module membership is not considered in this analysis. SFG_pole: superior frontal gyrus pole; SFG_PFC: superior frontal gyrus (prefrontal cortex), MFG: middle frontal gyrus, PCC: posterior cingulate cortex, IFG_tria: inferior frontal gyrus triangluaris, RG: rectus gyrus, LFOG: lateral frontal orbital gyrus.
