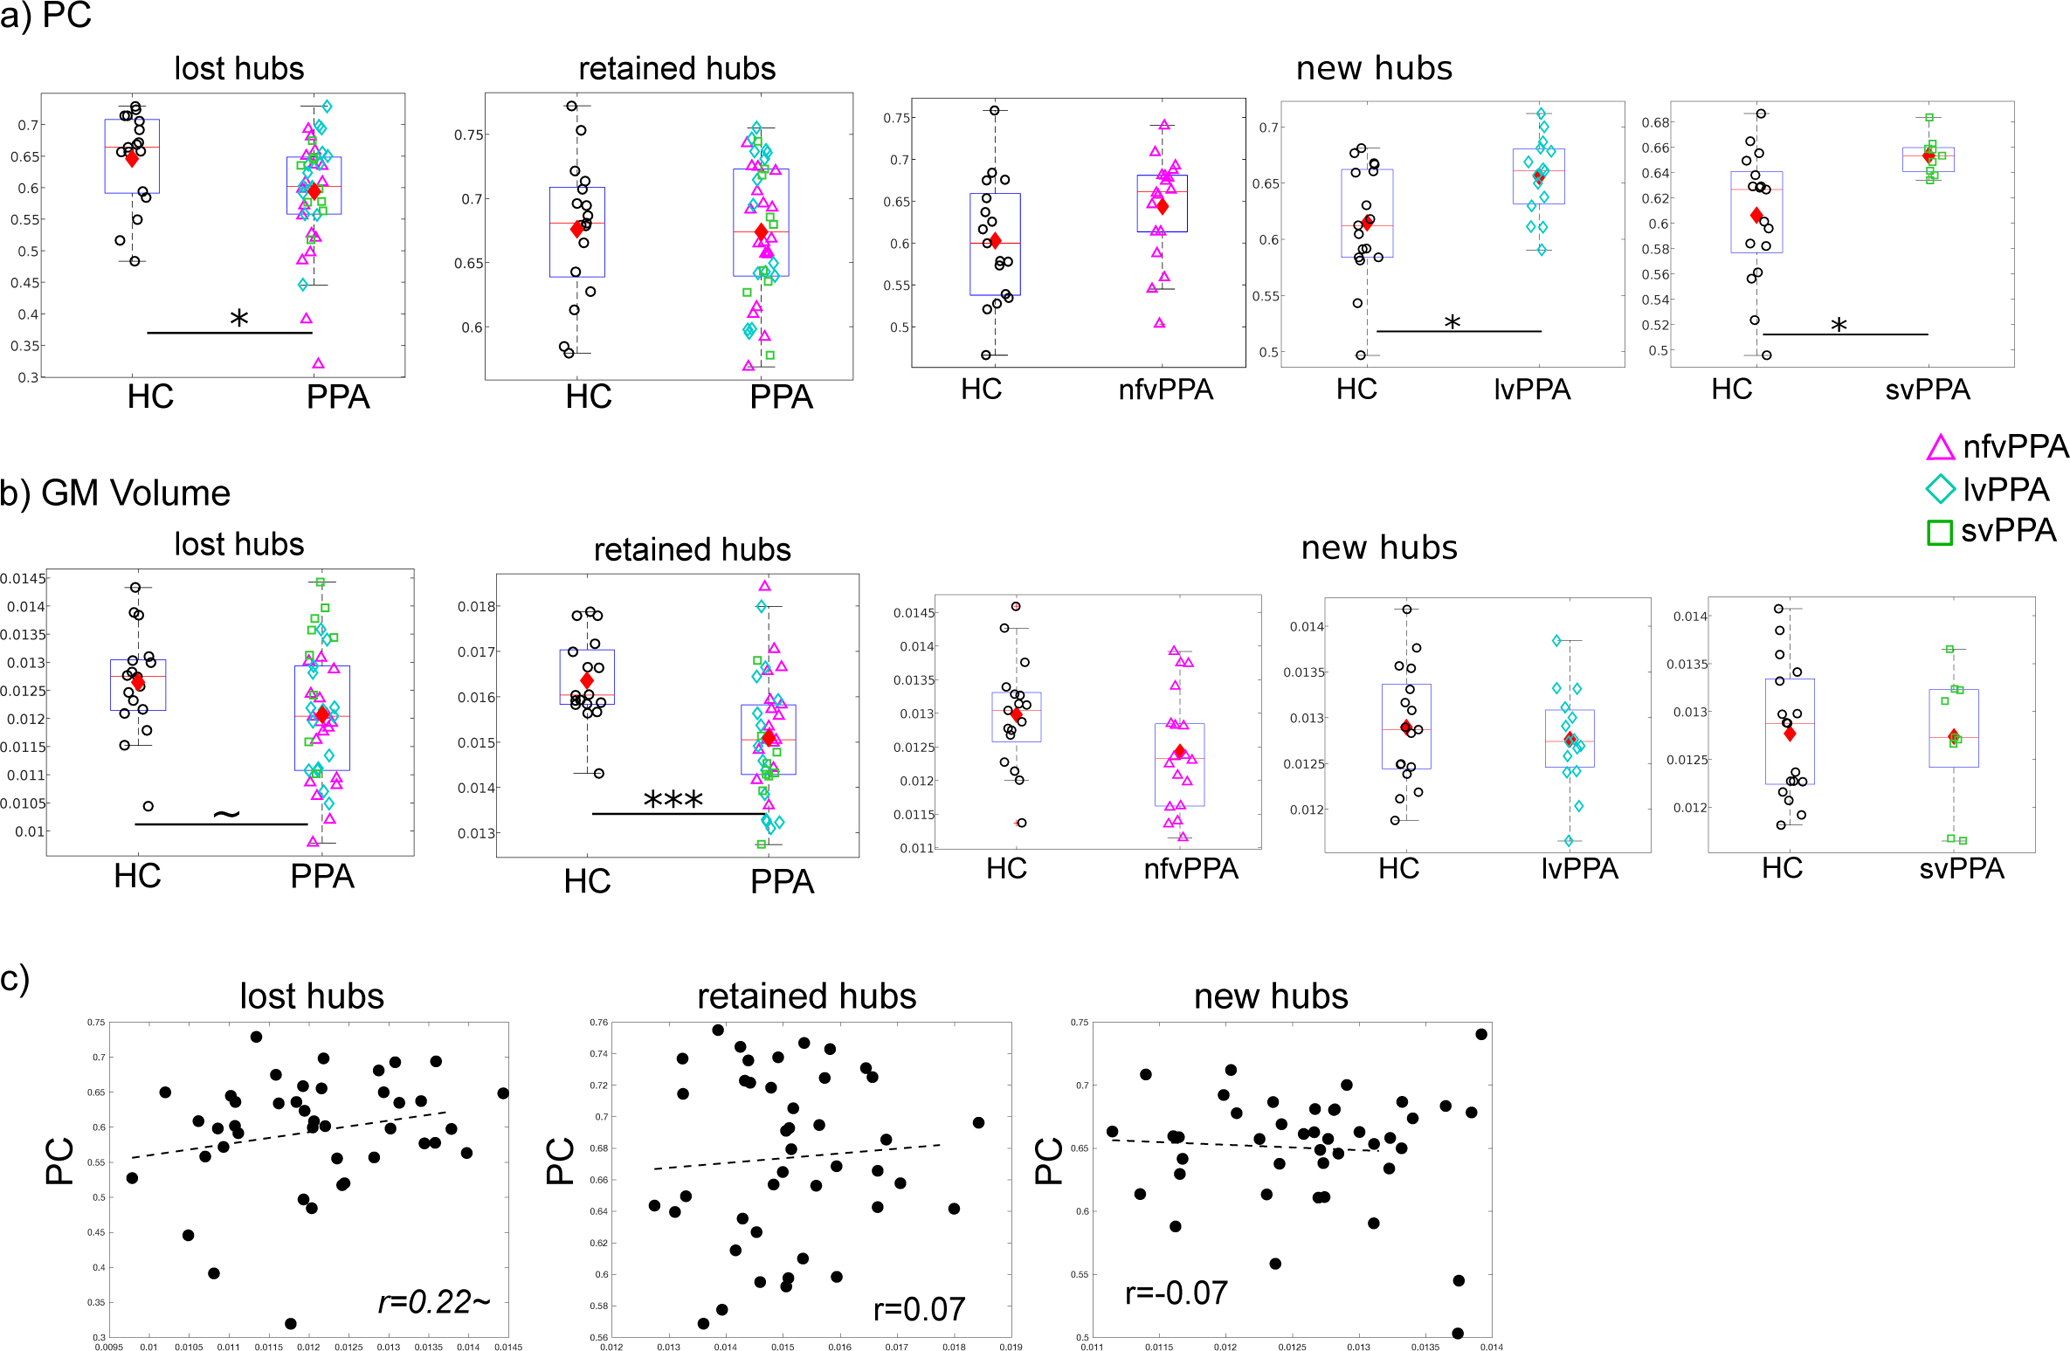
Figure 4. Global connectivitiy (PC) and gray matter volume of the lost, retained and new connector hubs.

a) Comparison of PC values between healthy controls (HC) and PPA. For the two lost hubs shared by all variants (see Fig. 3), PPA had significantly lower average PC (p=0.028). For the four retained hubs that were also shared by all variants (see Fig. 3), PPA did not differ from the HC in terms of average PC (p=0.88). For the new hubs of each variant (see Fig. 3b), all variants showed higher (or numerically higher) PC values than HC (Top to bottom: nfv: p=0.25; lv:p=0.0384; sv: p=0.0408, Bonferroni corrected). b) Comparison of gray matter volume: Compared to the HC group, the PPA group showed marginally smaller volume (p=0.06) for the lost hubs and also significantly smaller volume for the retained hubs (p=0.0006). No significant differences between the groups was found for the new hubs. The boxplots show the lower to upper quartile of the data with a line indicating the median, the diamonds indicate the mean. c) Correlations between hub connectivity (PC, y-axis) and volume (x-axis) for the three types of hubs combining all PPA variants (N=42). ~: p<0.1, *: p<0.05, **: p<0.01, ***: p<0.001.
