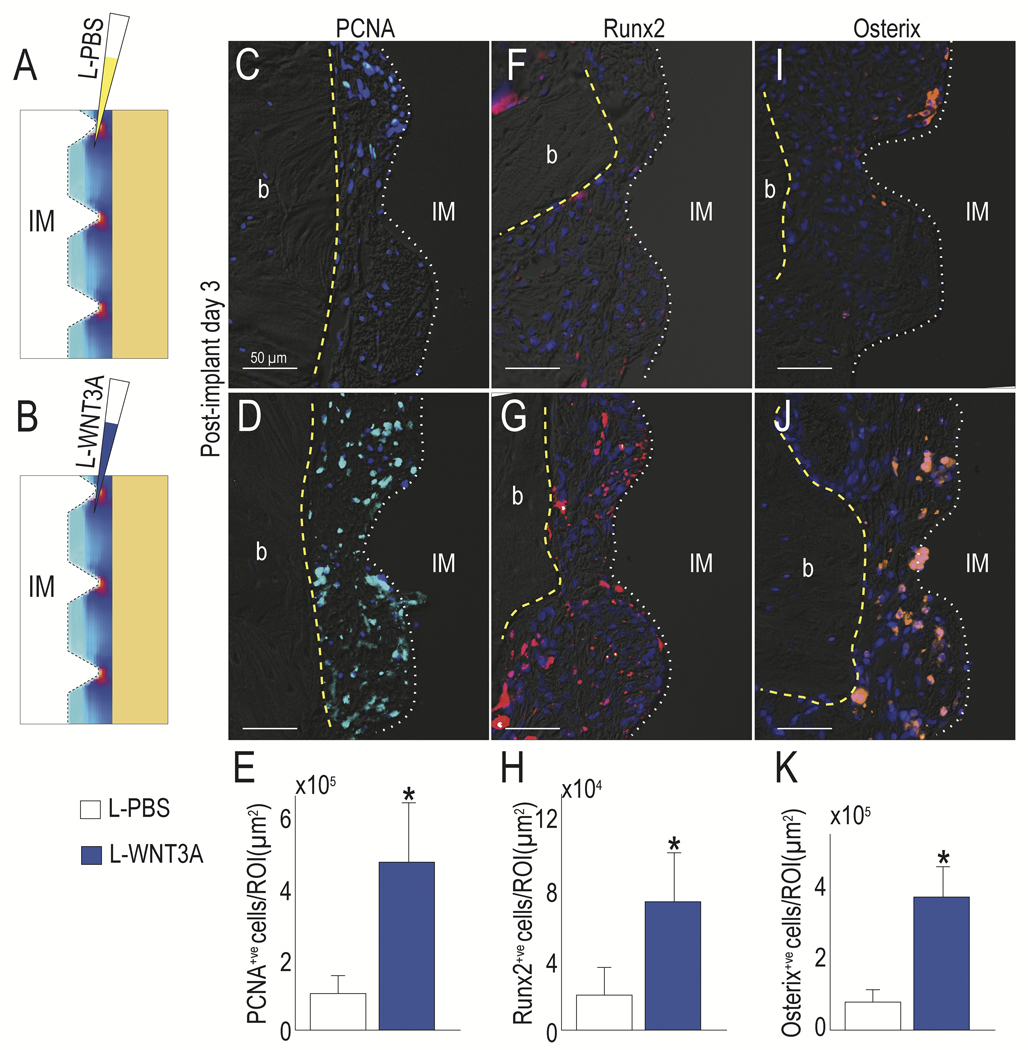
Fig. 2. L-WNT3A alters the fate of peri-implant cells towards an osteogenic lineage despite a high strain environment.
(A) Schematic of the experimental treatment, where L-PBS or (B) L-WNT3A were injected into the peri-implant environment, whose strain distribution is illustrated by a schematized heat map. PCNA expression in (C) control L-PBS vs (D) L-WNT3A treated groups was evaluated to detect proliferative cells (quantified in E), Runx2 expression in (F) control L-PBS vs (G) L-WNT3A treated groups (quantified in H) and Osterix expression in (I) control L-PBS vs (J) L-WNT3A treated groups (quantified in K) were evaluated to detect osteogenic differentiation. Abbreviations: b, bone; IM, implant. Scale bars = 50μm. Asterisk indicates p<.05.

