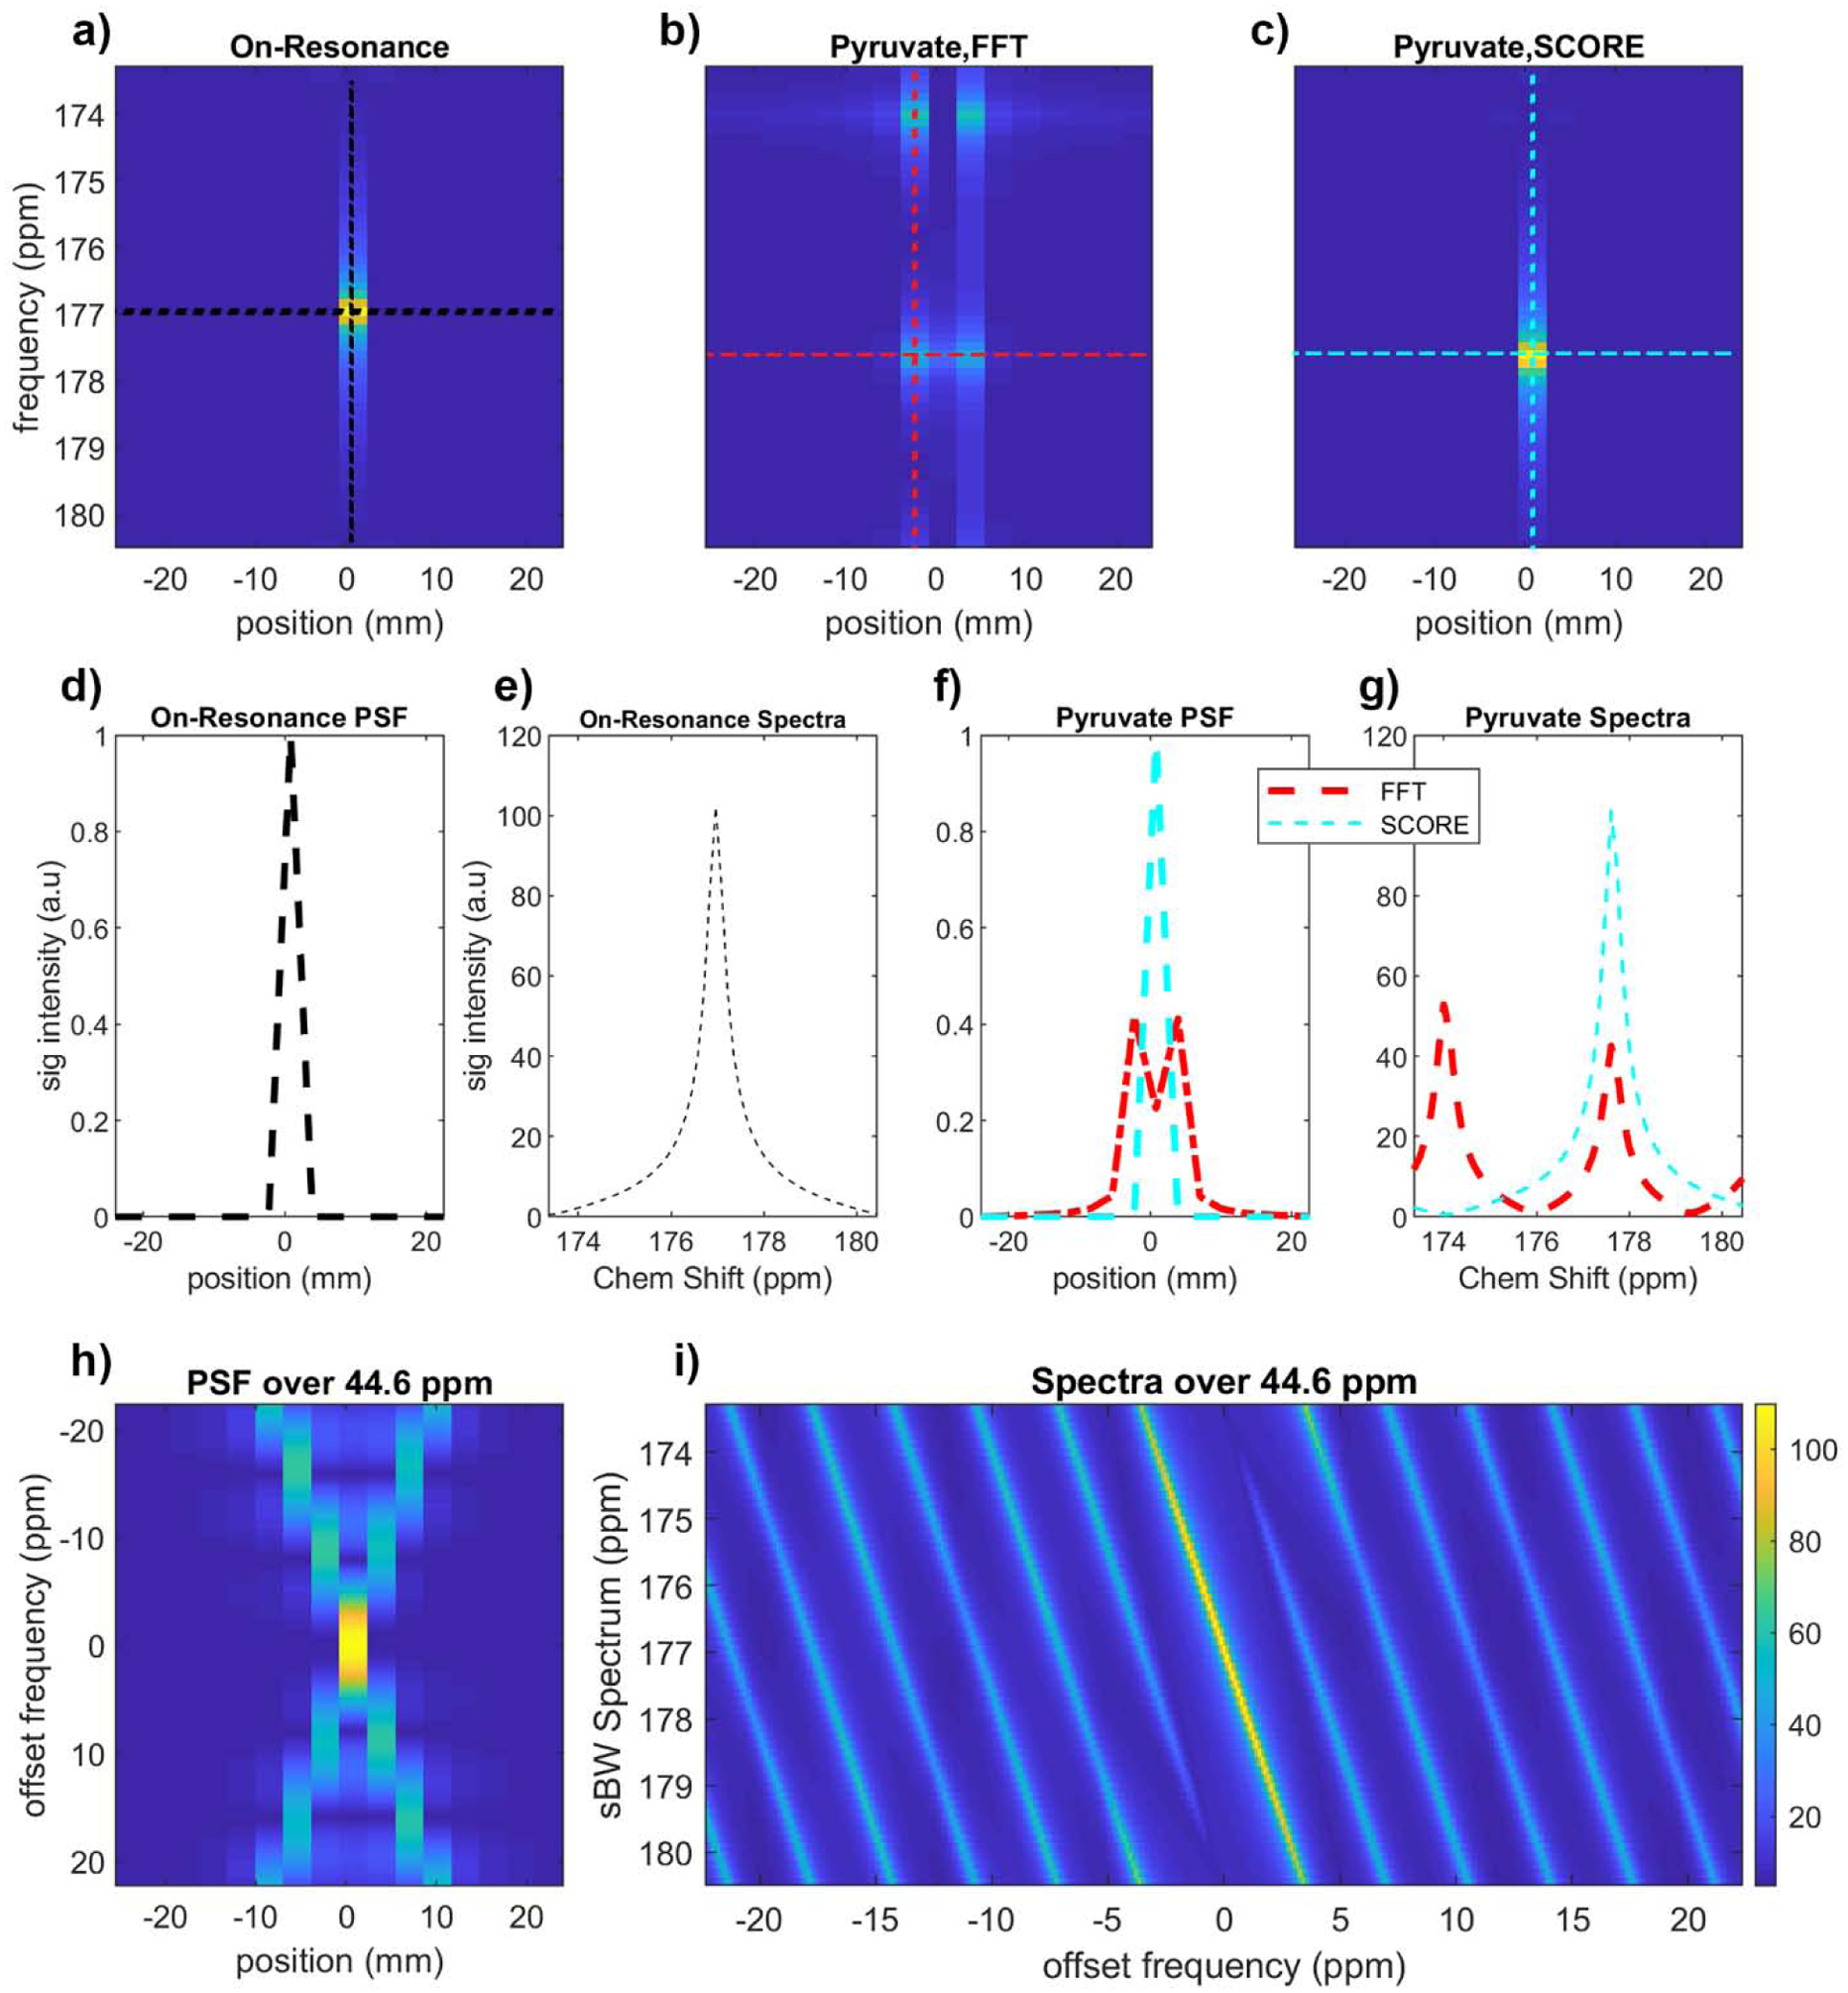
Figure 3.

Simulated spectra and point spread function (PSF) using a point source for symmetric EPSI sampling of off-resonance metabolites. (a) Signal from ideal on-resonance metabolites are not subject to spectral or spatial artifacts. (b) The same signal offset by −6.3 ppm to simulate pyruvate appears at an aliased frequency (dcs’), with an N/2 spectral ghost and blurring along the spatial dimension. (c) SCORE correction for this frequency offset eliminates these artifacts. (d,f) The spatial profile for on-resonance, off-resonance, and SCORE corrected data. (e,g) Spectral profiles for on-resonance, off-resonance, and SCORE corrected data (FWHM = 0.60 ppm, 0.59 ppm, FWHM = 0.60 ppm). (h) The spatial PSF of off-resonance metabolites. (i) N/2 spectral ghosts as a function of offset frequency. The frequency range in (h) and (i) encompass the maximum frequency difference between all corrected and uncorrected metabolites, from bicarbonate (160.9 ppm) to lactate (183.2 ppm).
