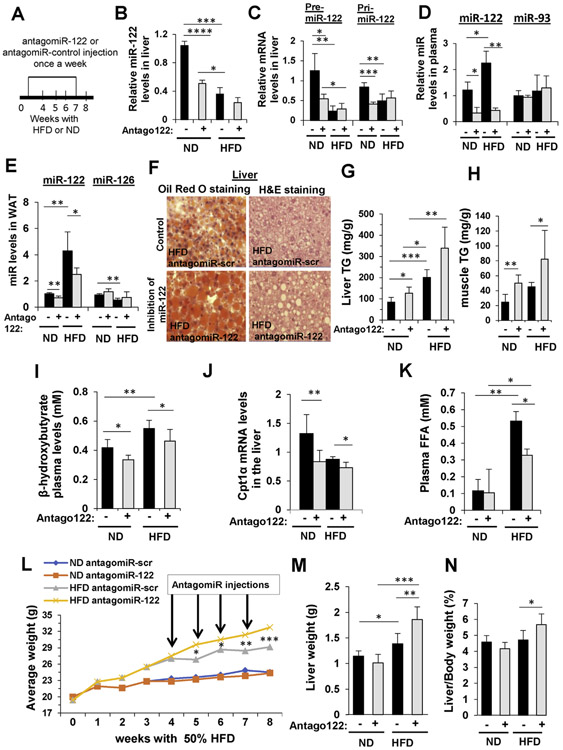
Figure 1.
Inhibition of MIR122 increases steatosis in HFD-fed mice. (A) Experimental design: C57BL/6 mice were fed for 4 weeks with chow diet (ND) or 50% HFD and administered 5 μg antagoMIR122 (Antago +) or antagomiR-scr (Antago −) once a week for 4 weeks. (B–E) qRT-PCR analysis of MIR122: (B) mature hepatic MIR122 levels, (C) hepatic pre- and pri-MIR122, and mature MIR122 levels in (D) plasma and in (E) WAT. miR-93 and miR-126 served as negative controls. (F) Oil Red O and H&E staining of liver sections. Scale bars represent 20 μm. (G, H) Colorimetric quantification of TG levels (G) in the liver and (H) in the muscle. (I) Plasma β-hydroxybutyrate. (J) qRT-PCR analysis of hepatic Cpt1α mRNA levels. (K) Colorimetric quantification of FFAs plasma levels. (L) Mice body weight during the treatments; arrows indicate time of antagomiR injections. (M) Liver weight. (N) Liver/body ratio measured when mice were killed. mRNA levels were normalized to hypoxanthine-guanine phosphoribosyltransferase (HPRT). Plasma microRNA levels were normalized to spiked C elegans miR-39; microRNA levels in the tissues were normalized to RNU6. Data are represented as mean ± SD. n = 6. *P < .05, **P < .01. ***P < .001, ****P < .0001. M, mol/L.

