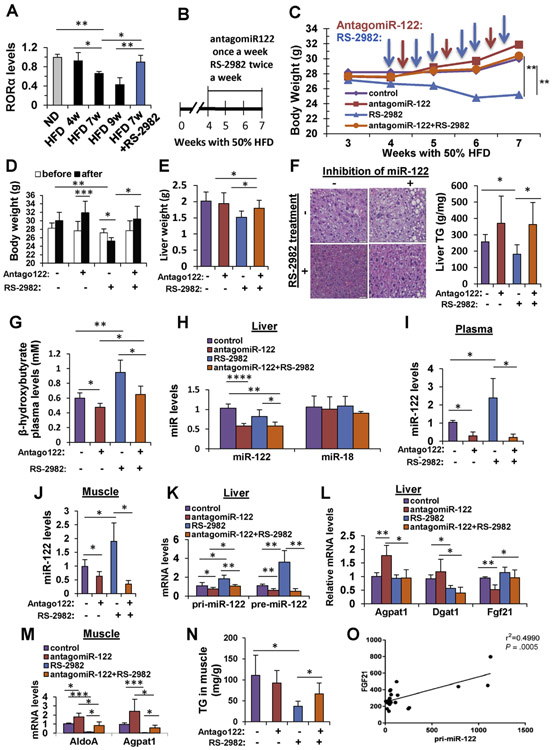
Figure 4.
The RORA agonist RS-2982 reduces steatosis via increased MIR122 expression in HFD-fed mice. (A) qRT-PCR analysis of hepatic RORA mRNA levels extracted from mice livers after 4, 7, and 9 weeks of feeding with 50% HFD. Mice that were intraperitoneally injected with 7.5 mg/kg of the RORA agonist RS-2982 after 4 weeks of HFD for 3 weeks (overall, 7 weeks under HFD feeding) show rescued RORA mRNA levels. (B) Experimental design: C57BL/6 mice were fed with HFD (to induce steatosis), and after 4 weeks, they were injected intravenously with antagoMIR122 (Antago122 +) or antagomiR-control (Antago122 −) once a week, together with 7.5 mg/kg RS-2982 (or saline) intraperitoneally twice a week, for 3 weeks. (C) Mice body weight during the experiment. Blue arrows indicate the time of intraperitoneal injections of RS-2982 (or saline), and orange arrows represent the time of intravenous antagomiR (122 or control) injections. (D) Body weight before injections and after the last injection. (E) Liver weight determined at the end of the experiment. (F) H&E staining of treated mice livers (scale bars represent 20 μm); colorimetric quantification of liver TG levels. (G) Colorimetric quantification of plasma β-hydroxybutyrate. (H–J) qRT-PCR analysis of mature MIR122 (H) in the liver (control miR-18 levels were not affected after RS-2982 treatment), (I) plasma MIR122 levels, and (J) muscle. (K) pri-MIR122 and pre-MIR122 in the liver. (L) MIR122 (Agpat1 and Dgat1) and RORA (Fgf21) target genes in the liver. (M) MIR122 target genes (AldoA and Agpat1) in the muscle. (N) Muscle TG content in the described treatments. Supplementary Table 6 shows that pri-MIR122 is not expressed in muscle tissue. (O) RNA-sequencing analysis of RNA extracted from liver tissues showing a positive correlation between pri-MIR122 and Fgf21 (RORA target gene) mRNA expression. Plasma microRNA levels were normalized to spiked C elegans miR-39; microRNA levels in the tissues were normalized to RNU6. mRNA levels were normalized to HPRT. Data are represented as mean ± SD. n = 6. *P < .05, **P < .01 ***P < .001, ****P < .0001.

