
Figure 3. Exposure to Loud and Very Loud Noise Alters Stereocilia Morphology and Reduces Synaptic Density across the Middle and Base of the Cochlea.
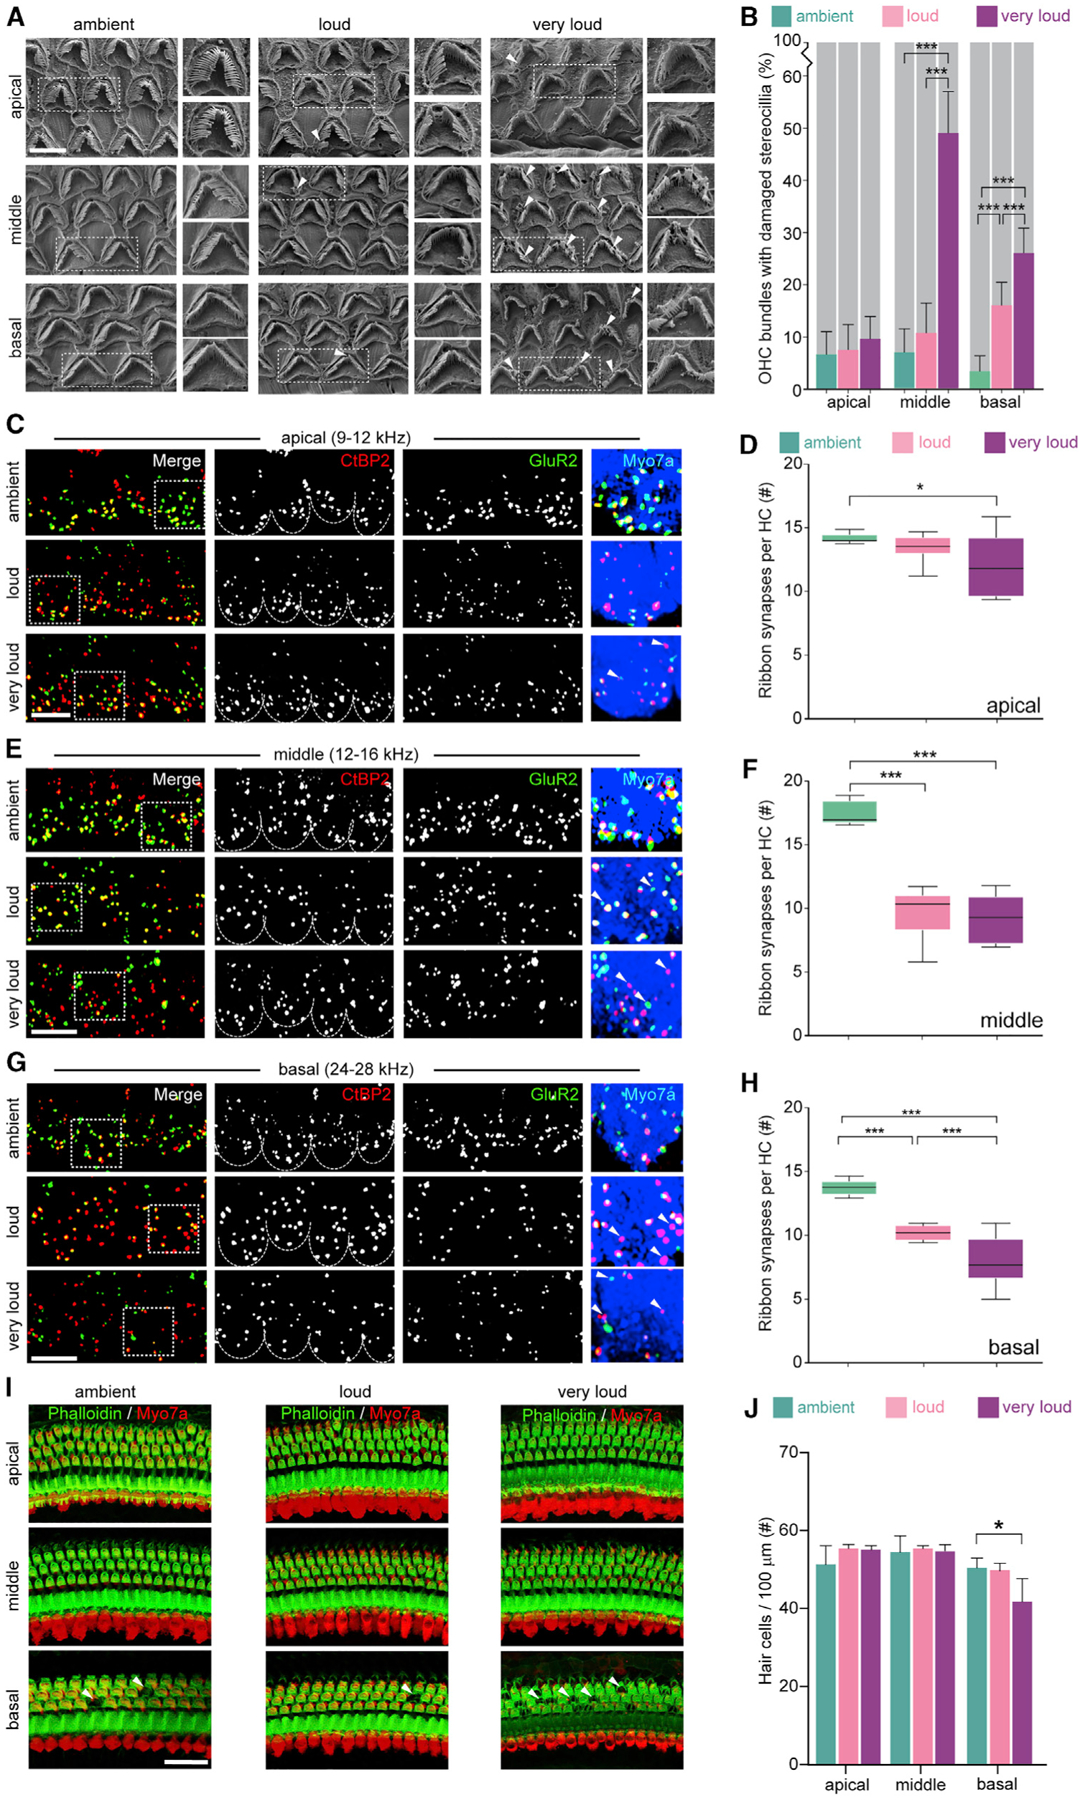
(A) Representative SEM images of stereocilia bundles from cochlea whole mounts prepared immediately after noise exposure from apical (8–12 kHz), middle (12–16 kHz), and basal (28–32 kHz) regions (i.e., 80%, 65%, and 40% of the distance from the base, respectively).
(B) Percentage of stereocilia bundles with visible fraying was significantly elevated following exposure to increasingly intense noise across the middle region (ambient = 7.48 ± 4.84, loud = 10.70 ± 5.59, and very loud = 49.35 ± 8.21, mean ± SD) and basal region (ambient = 3.54 ± 3.35, loud = 15.95 ± 5.26, and very loud = 26.48 ± 5.03, mean ± SD). The apex was largely unaffected by the intensity of the exposure (70 dB = 6.76 ± 4.64, 94 dB = 7.31 ± 4.78, and 105 dB = 9.58 ± 4.40, mean ± SD). n = 645, 585, and 719 bundles analyzed for ambient, loud, or very loud noise, respectively.
(C–H) Representative images and quantification of synapse density from apical, middle, and basal regions. Cochlear synaptic density within the apical region was significantly reduced in the very loud versus ambient groups (ambient = 14.20 ± 0.37, loud = 13.45 ± 1.04, and very loud = 12.00 ± 2.44, mean ± SD). Cochlear synapse density was significantly reduced in the middle and basal regions following exposure to both loud and very loud noise compared with ambient noise (middle: ambient = 17.52 ± 0.93, loud = 9.71 ± 1.90, and very loud = 9.18 ± 1.82; base: ambient = 13.97 ± 0.44, loud = ± 0.74, very loud = ± 1.98, mean ± SD).
(I) Representative images of HC density across the cochlea.
(J) Base had slightly reduced HC density in the very loud group compared with the loud and ambient groups (ambient = 55.19 ± 1.22, loud = 55.70 ± 1.01, and very loud = 50.87 ± 2.94, mean ± SD).
Scale bars, 5 μm (A), 10 μm (B–D), and 20 μm (C, E, and G). *p = 0.05, ***p < 0.001 by one-way ANOVA with Bonferroni correction (B, D, F, H, and J). n = 3 mice (A and B), 4 mice (C–H), and 3–6 mice (I and J).