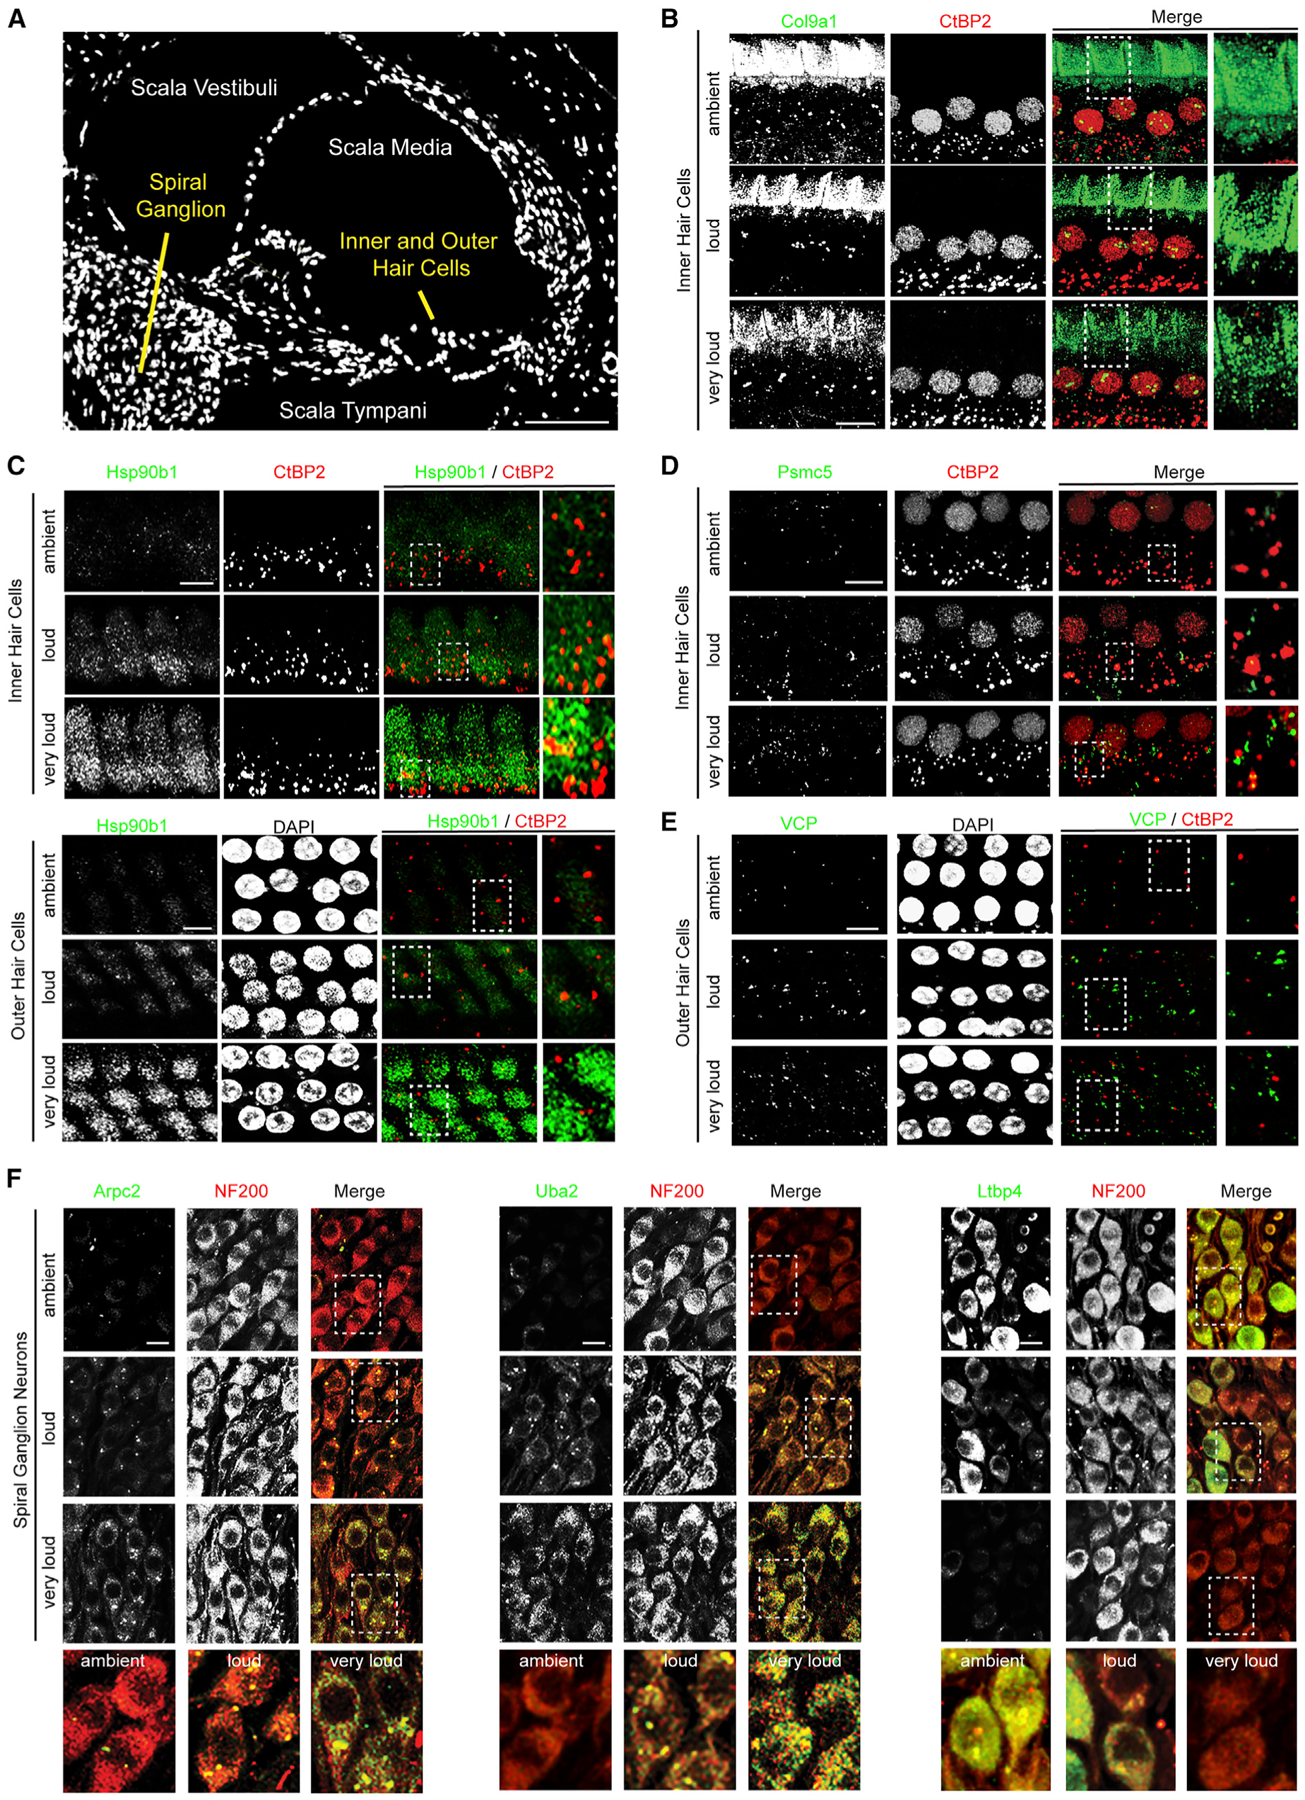
Figure 4. Proteins Regulated during Noise Exposure Are Expressed by HCs, SGNs, and Supporting Cells within the Cochlea.

(A) DAPI-stained midmodiolar cochlear section.
(B) Col9a1 signal decreases in the area above the tunnel of Corti following noise exposure. Green, Col9a1; red, CtBP2.
(C) Hsp90b1 levels are elevated in both IHCs and OHCs after exposure to increasing intensities of noise. Green, Hsp90b1; red, CtBP2; white, DAPI.
(D) Psmc5 levels increase after exposure to increasing noise intensity within IHCs. Green, Psmc5; red, CtBP2.
(E) Vcp levels are elevated in the OHCs after exposure to increasingly damaging levels of noise. Green, Vcp; red, CtBP2; white, DAPI.
(F) SGNs from the second ganglion bundle from the top of the cochlea (12–16 kHz) in midmodiolar sections. Left: Arpc2 levels are elevated in SGNs after exposure to increasingly damaging levels of noise. Middle: Uba2 levels progressively increase within SGNs with increasing noise exposure. Right: LtBP4 levels are reduced in SGNs after exposure to increasingly damaging levels of noise. Green, Arpc2, Uba2, and LtBP4 (left, middle, and right); red, NF200.
Scale bars, 100 μm (A) and 10 μm (B–F). Representative images from n = 2 animals.
