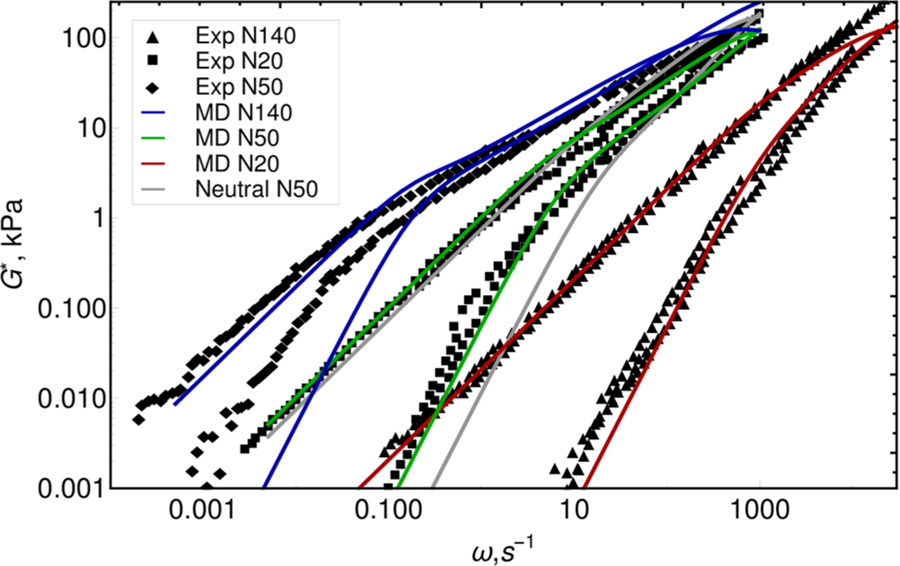
Figure 5.
Prediction for dynamic modulus superimposed on experimental data.47 Filled symbols show the G′ elastic component of the modulus, and empty symbols show the G′ viscous component of the modulus. Predictions are scaled by 500 kPa vertically and by {0.0006 s, 0.012 s, and 0.12 s} for N20, N50, and N140 horizontally. Also shown is the dynamic modulus of the neutral N50 polymer at the same concentration as coacervate.

