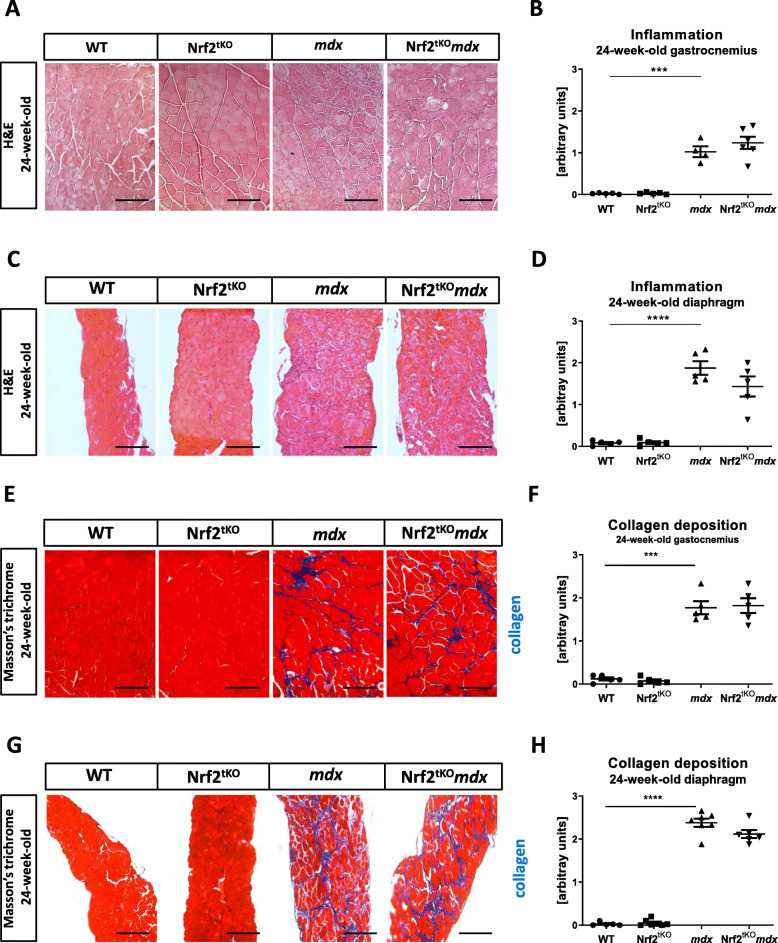
Fig. 13.
Inflammation and fibrosis in muscles of non-exercised 24-week-old WT, Nrf2tKO, mdx, and Nrf2tKOmdx mice. (a) Representative photos and (b) semi-quantitative analysis of inflammation in GM based on H&E staining; n = 4-6. (c) Representative photos and (d) semi-quantitative analysis of inflammation in diaphragm based on H&E staining; n = 5. (e) Representative photos and (f) semi-quantitative analysis of collagen deposition in GM based on Masson’s trichome staining; n = 5. (g) Representative photos and (h) semi-quantitative analysis of inflammation in diaphragm based on Masson’s trichome staining; n = 5-7. The data are presented as mean +/− SEM; ***p ≤ 0.001; ****p ≤ 0.0001, one-way ANOVA with Tukey’s post hoc test; the scale bars represent 100 μm

