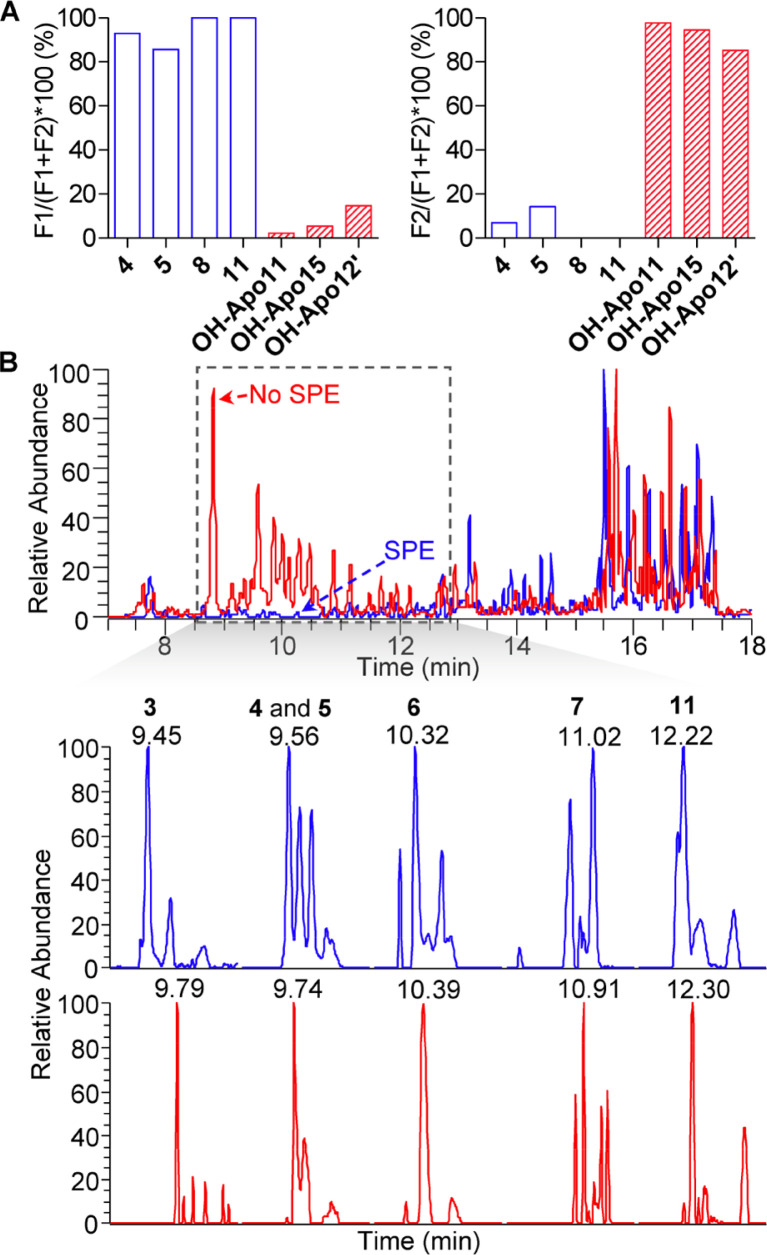
Figure 3.
Effect of the SPE purification on the detection of T3- derivatized DIALs. (A) Optimal SPE purification procedure. (B) Total ions chromatograms (TICs) of tomato samples with (blue) and without (red) SPE purification (top) and EICs of representative endogenous T3-derivatized DIALs with (blue) and without (red) SPE purification (bottom).

