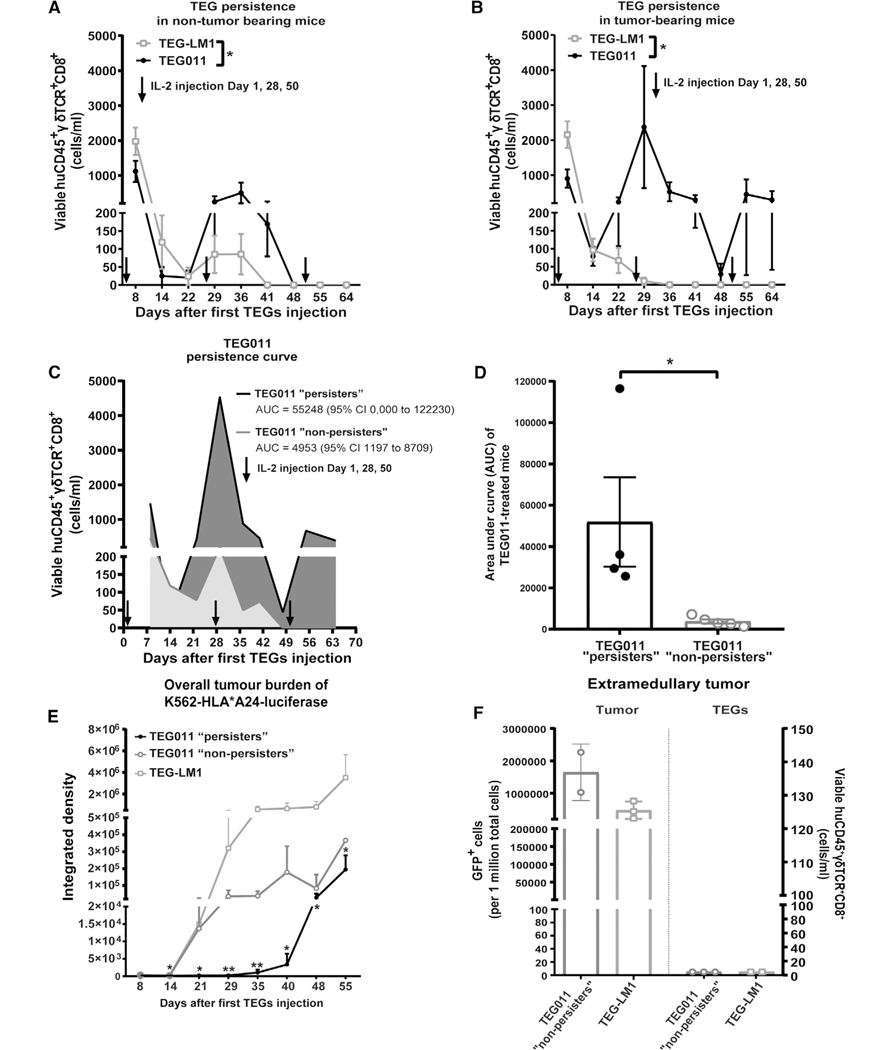
FIGURE 3. Long-term persistence of TEG011 cells in peripheral blood of tumor-bearing mice and its association with tumor burden.
(A) TEG persistence was measured in peripheral blood by quantifying for absolute cell numbers of by flow cytometry for TEG-LM1 mock (open light gray rectangle) and TEG011 (filled black circle) in nontumor-bearing mice. Data represent mean ± SEM of all mice per group (n = 5 mice). Statistical significances were calculated by mixed-effects model with repeated measures; *, P < 0.05. (B) TEG persistence was measured in peripheral blood by quantifying for absolute cell numbers by flow cytometry for TEG-LM1 mock (open light gray rectangle; n = 10 mice) and TEG011 (filled black circle; n = 9 mice) in tumor-bearing mice. Data represent mean ± SEM of all mice per group. Statistical significances were calculated by mixed-effects model with repeated measures; *, P < 0.05. (C) Area under the curve (AUC) of CD8+ TEG011 persistence were calculated for both TEG011 “persisters” (black line, dark gray area; 4/9 mice) and TEG011 “nonpersisters” (gray line, light gray area; 5/9 mice) up to 64 d after infusion. Data represent mean ± SEM of all mice per group. 95% Confidence Interval (95% CI) were tabulated for AUC of both subgroup. (D) Mean AUC of CD8+ TEG011 persistence from individual mouse of both TEG011 “persisters” (filled dark gray bar; 4/9 mice) and TEG011 “nonpersisters” (filled light gray bar; 5/9 mice) groups were tabulated and shown as mean ± SEM of all mice per group. Statistical significances were calculated by nonparametric Mann-Whitney t-test; *, P < 0.05. (E) Tumor burden for K562 HLA*A24-luciferase was assessed in vivo by bioluminescence imaging (BLI) measuring integrated density of the entire area of mice with abdomen facing up. Data shown as mean ± SD of all mice per group (TEG011 “persisters” (filled black circle; 4/9 mice), TEG011 “nonpersisters” (open dark gray circle 5/9 mice), and TEG-LM1 mock (open light gray rectangle; n = 10 mice)). Statistical significances were calculated by nonparametric Mann-Whitney t-test in comparison to TEG-LM1 mock control; *, P < 0.05; **, P < 0.01. (F) Tumor burden for K562 HLA*A24-luciferase and infiltrating CD8+ TEGs were assessed from isolated extramedullary tumor masses by quantifying for absolute cell number GFP+ cells and viable huCD45+γδTCR+CD8+ by flow cytometry, respectively. Each symbol represents an individual mouse per treatment group that developed extramedullary tumor masses. Readouts on infiltrating T cells are set to 5 cells/mL for individual mouse in the Y-axis for data visualization purpose. Data represent mean ± SD of all mice per group (TEG011 “nonpersisters” (open dark gray circle; 2/5 mice) and TEG-LM1 mock (open light gray rectangle; 3/10 mice)). FACS analyses of extramedullary tumor mass from TEG-LM1 group were only obtained from 3 out of 4 mice

