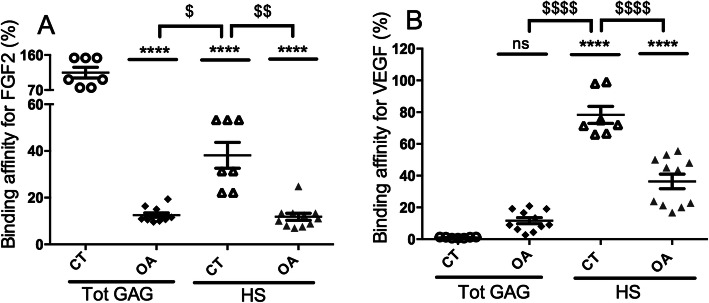
Fig. 3.
Percentage of binding affinity of total GAG and HS for FGF2 and VEGF. a The IC50 of total GAG from control articular cartilages (CT, n = 7) was considered 100% of binding to FGF2 and used to calculate the % of binding affinity of all other GAG (OA total GAG, n = 11, CT HS and OA HS) for FGF2. b The IC50 of total GAG from control articular cartilages was considered 1% of binding to VEGF and used to calculate the % of binding affinity of all other GAG (OA total GAG, n = 11, CT HS and OA HS) for VEGF. Each GAG sample was tested in duplicate in each experiment and the mean of the duplicate was considered the value of the GAG sample. All values per group are expressed as a mean ± SEM. P values were calculated using an ordinary one-way ANOVA test followed by pairwise comparisons using the Dunnett test compared to CT total GAG (**< 0.01, ***< 0.001, ****< 0.0001) or to CT HS ($< 0.05, $$< 0.01, $$$< 0.001, $$$$< 0.0001)

