Figure 10.

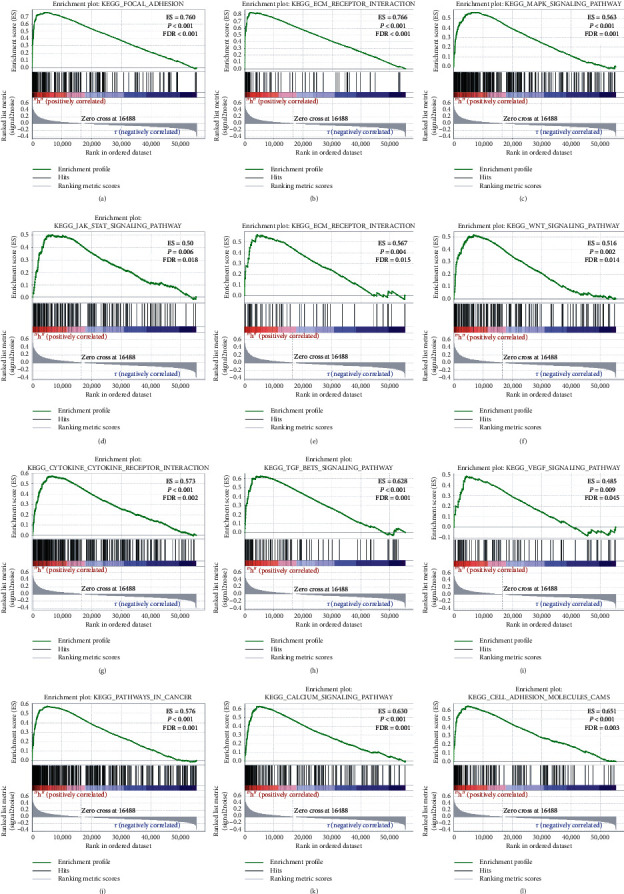
Gene enrichment analysis results of ITGA5 in GC patients according to the TCGA database. A–M, GSEA results of the C2 gene set of the ITGA5 high expression group.

Gene enrichment analysis results of ITGA5 in GC patients according to the TCGA database. A–M, GSEA results of the C2 gene set of the ITGA5 high expression group.