Figure 2.

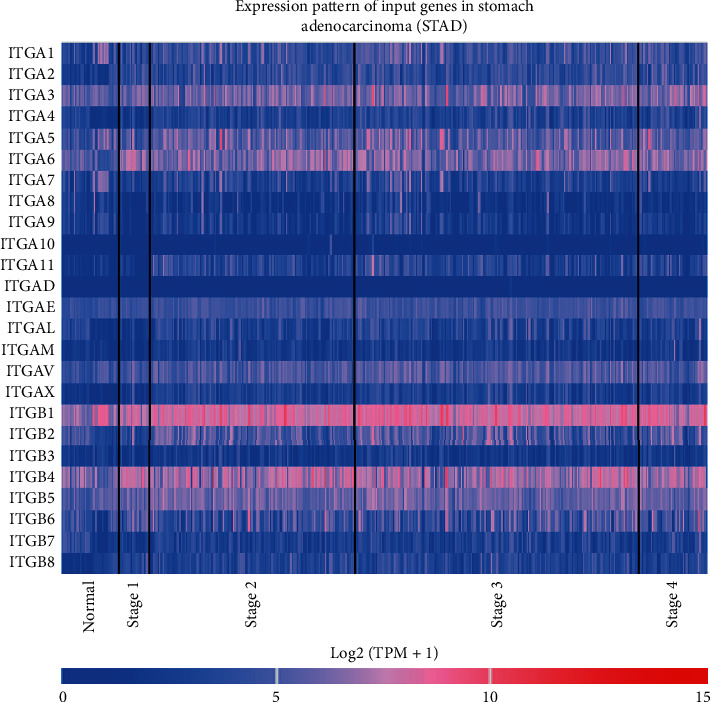
Expression of ITGs in GC patients according to the UCSC XENA database. The red color indicates high expression; the blue color indicates low expression.

Expression of ITGs in GC patients according to the UCSC XENA database. The red color indicates high expression; the blue color indicates low expression.