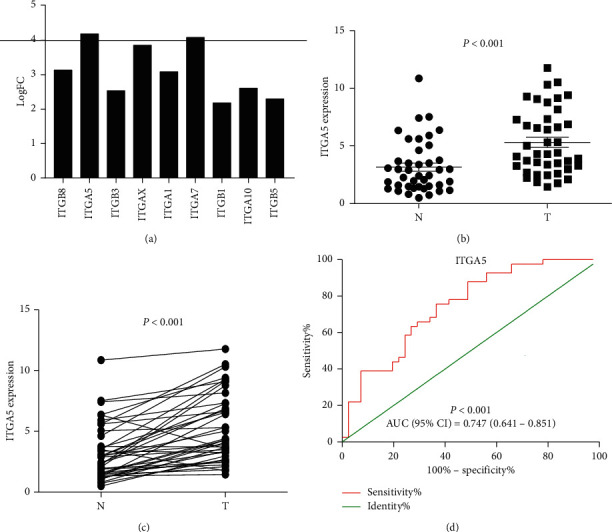
Figure 8.

ITGA5 relative expression in normal tissues and cancer tissues detected by RT–PCR. (a) According to the standard of q-value <0.05 and difference multiple |fold change| > 2, the differentially expressed genes in ITGs were screened out from 10 pairs of gastric cancer tissue samples, and the fold change of ITGA5 was the highest; (b) and (c) ITGA5 mRNA relative expression in GC tissues (n = 40, t-test); (d) the diagnostic ROC curve of the distribution of ITGA5 relative expression.
