Figure 9.

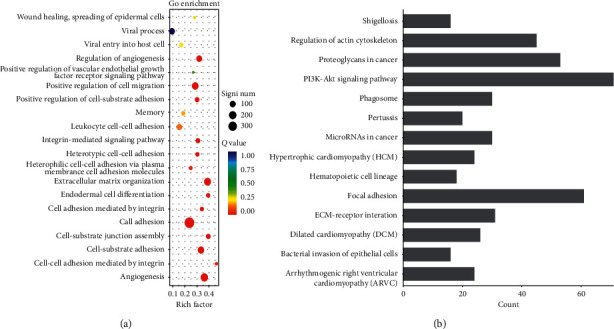
KEGG and GO enrichment analysis results of ITGA5 gene in GC tissue sequencing data, showing the biological processes and signaling pathways involved in ITGA5.

KEGG and GO enrichment analysis results of ITGA5 gene in GC tissue sequencing data, showing the biological processes and signaling pathways involved in ITGA5.