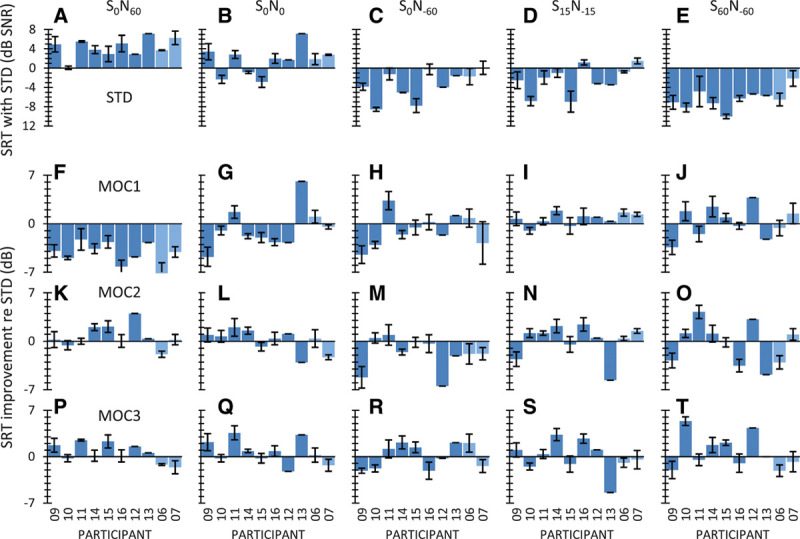
Fig. 4.

Intelligibility in unilateral listening for individual participants. Row 1 (panels A to E), SRTs for the STD strategy. Each panel is for a different spatial configuration of the speech and noise sources, as indicated at the top. Rows 2 to 4 (panels F to T), SRT improvement relative to the STD strategy for the different MOC strategies (MOC1, MOC2, and MOC3). Data are shown for eight bilateral (darker bars) and two unilateral CI users (SA006 and SA007, lighter bars). Error bars illustrate 1 standard error of the mean. CI indicates cochlear implant; MOC, medial olivocochlear; MOC1, original fast MOC strategy; MOC2, slower MOC strategy; MOC3, slower MOC strategy with comparatively greater contralateral inhibition in the lower-frequency than in the higher-frequency channels; N, noise; S, speech; SNR, signal-to-noise ratio; SRT, speech reception threshold; STD, standard.
