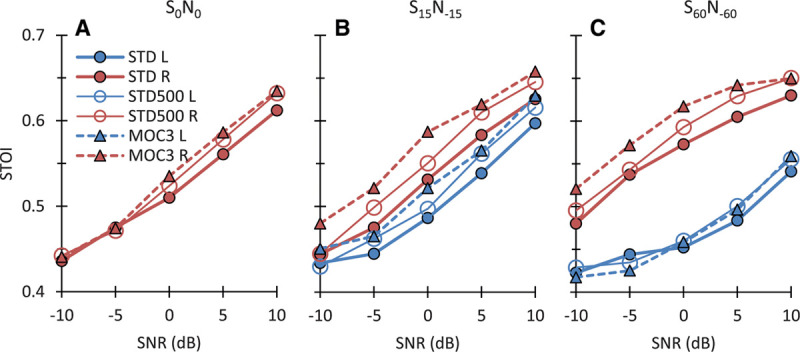
Fig. 9.

Comparison of STOI scores for the present STD and MOC3 strategies against scores for a STD strategy with c = 500, the value typically used by the participants in their clinical audio processors. Each panel shows scores for the left (L) and right (R) ears (blue and red traces, respectively) and for different SNRs. Each panel is for a different spatial configuration of the target and speech sources, as indicated at the top of the panel. Note that for most SNRs and for the ear closer to the speech source (the right ear), STOI scores were equal or higher for the MOC3 strategy than for any of the two STD strategies. MOC indicates medial olivocochlear; MOC1, original fast MOC strategy; MOC2, slower MOC strategy; MOC3, slower MOC strategy with comparatively greater contralateral inhibition in the lower-frequency than in the higher-frequency channels; N, noise; S, speech; SNR, signal-to-noise ratio; STD, standard; STOI, short-term objective intelligibility.
