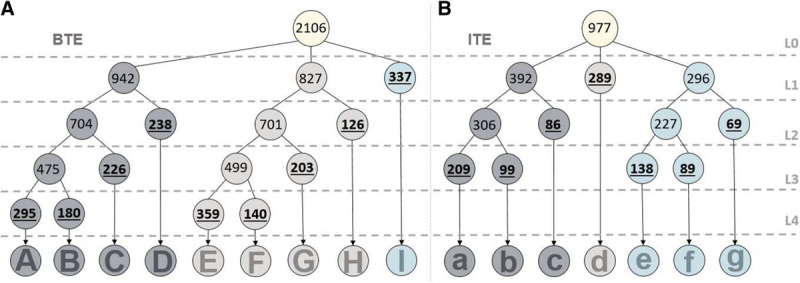
Fig. 1.

Graphical representation of the final LCT results: (A) the BTE subset, and (B) the ITE subset. The top node for each model is the starting point for the model at level 0, the modalities are at the lowest level at the end of the tree. The underlined numbers inside the nodes correspond to the number of allotted hearing aids. The allocation of hearing aids to a class is based on probabilities. Therefore, slight deviations could occur between the sum of child nodes and the parent node. BTE indicates behind-the-ear; ITE, in-the-ear; LCT, Latent Class Trees.
