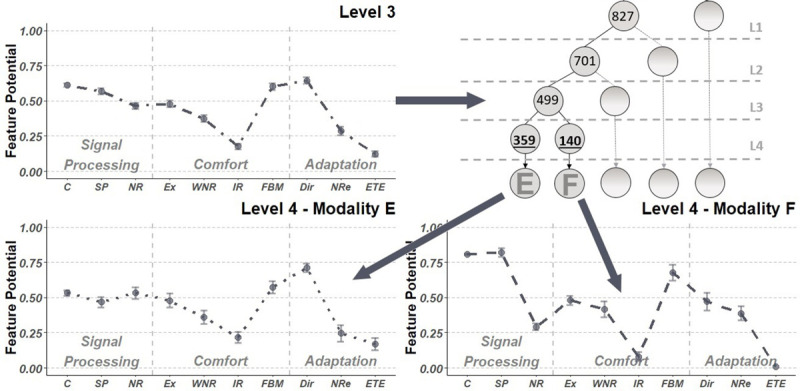
Fig. 2.

Example showing the dependency of hearing aid feature profiles on prior “parent” models; each LCA model in the tree is dependent on (all) prior LCA model results up to the lowest level at the end of the tree. The bottom profile plots show the formation of two different profiles within the first BTE branch. In this example, a “parent” model at level 3 (striped dark grey line; highlighted in the top left panel) splits into two “child” nodes (schematically shown in the top right panel). As there were no further splits from the models at the bottom panels onward, the results at this level were considered BTE modality E and F. Mean hearing aid feature data were rescaled between 0 and 1 to enable a straightforward comparison between different scaled variables. Features were ordered according the three domains: signal processing, comfort, and adaptation. Whiskers show a 95% confidence interval of the specific feature. The lines between the points do not refer to a dependency between adjacent features, but were included to interpret and compare the feature profiles between modalities. Labels x axis: compression (C), sound processing (SP), noise reduction (NR), expansion (Ex), wind noise reduction (WNR), impulse (noise) reduction (IR), active feedback management (FBM), directionality (Dir), noise reduction environments (NRe), ear-to-ear communication (ETE). BTE indicates behind-the-ear; LCA, Latent Class Analysis.
