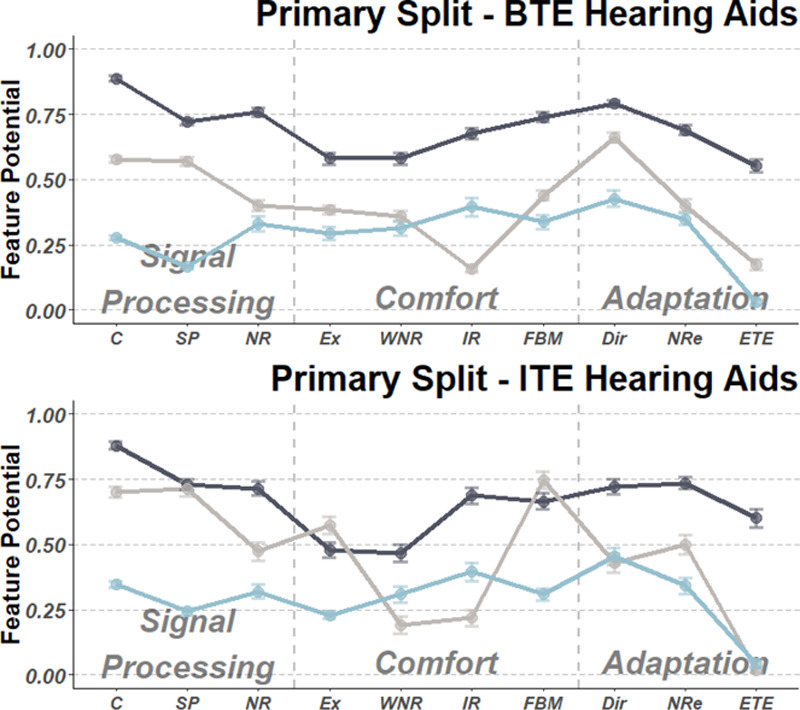
Fig. 3.

Profiles plots primary node, for the BTE subset (upper panel) and the ITE subset (lower panel): profile 1 (dark grey), profile 2 (light grey), profile 3 (blue). For axis configuration, see also Figure 2. BTE indicates behind-the-ear; ITE, in-the-ear.
