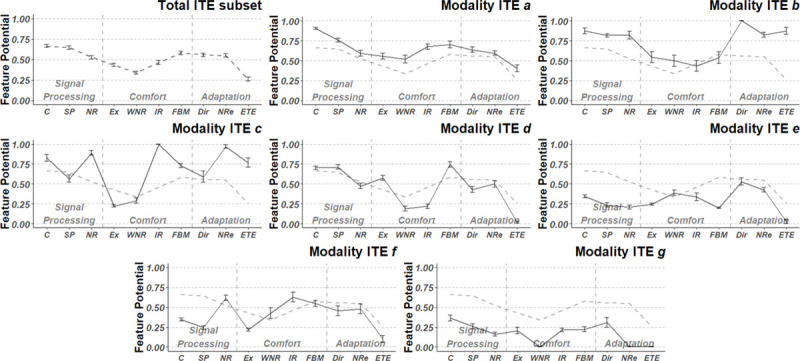
Fig. 5.

Profile plots of seven final ITE modalities a to g: solid lines represent mean features measures for the specific modality, while dashed lines show mean feature measure of all devices in the dataset. For axis configuration, see also Figure 2. ITE indicates in-the-ear.
