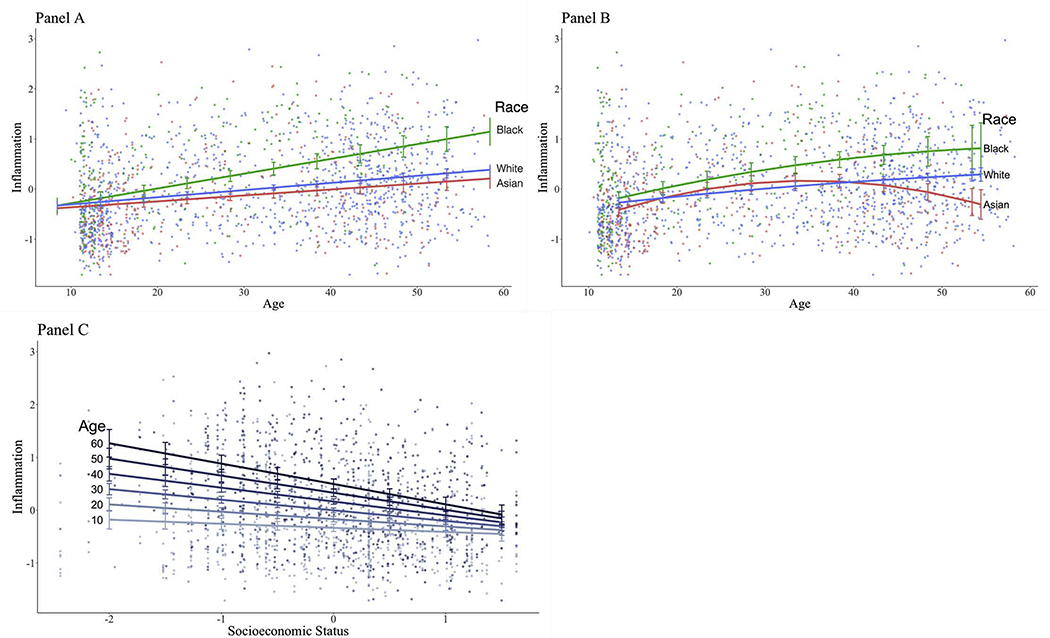
Figure 2.
Interaction effect between linear age and race (Panel A), curvilinear age and race (Panel B), and linear age and SES (Panel C) on inflammation. Points represent unadjusted inflammation data and differences in color represent different levels of race and age as indicated by the corresponding legends. Panels A and B presents the linear and curvilinear adjusted slopes between age and inflammation at each level of race. Panel C presents the adjusted slopes between SES and inflammation at each decade of age. All models were adjusted for main effects of age, race, SES, and sex at birth.

