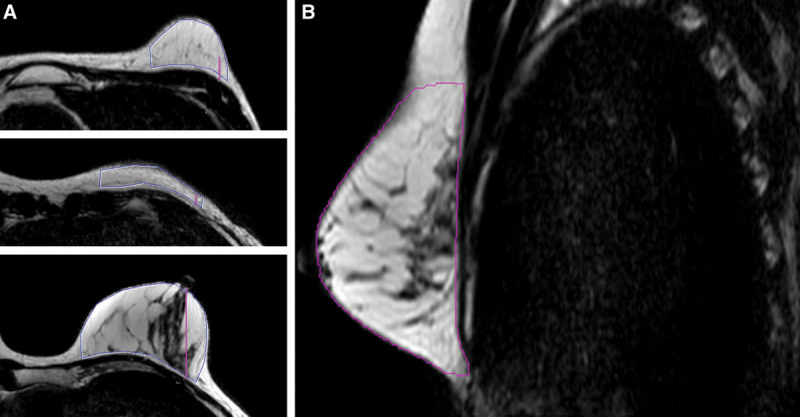
Fig. 2.

MRI image of the breast. A, For this ROI, the breast contour was followed using the borders of the convexity of the breast to define the lower and upper borders. B, Several extra ROIs were drawn on the axial images in between the upper and lower boundary.
