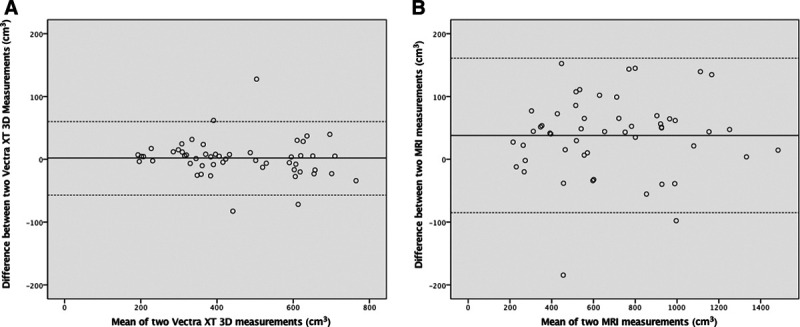
Fig. 3.

Comparison of reliability 3D and MRI breast measurements. A, The Bland–Altman plot comparing the 3D measurements demonstrates a mean difference of 1.73 (limits of agreement ranging from –56.9 to 60.3) between the 2 observers. B, The Bland–Altman analysis comparing 2 MRI measurements demonstrates a mean difference of 38.4 (limits of agreement ranging from –84.5 to 161.3) between the 2 observers.
