
Figure 3.
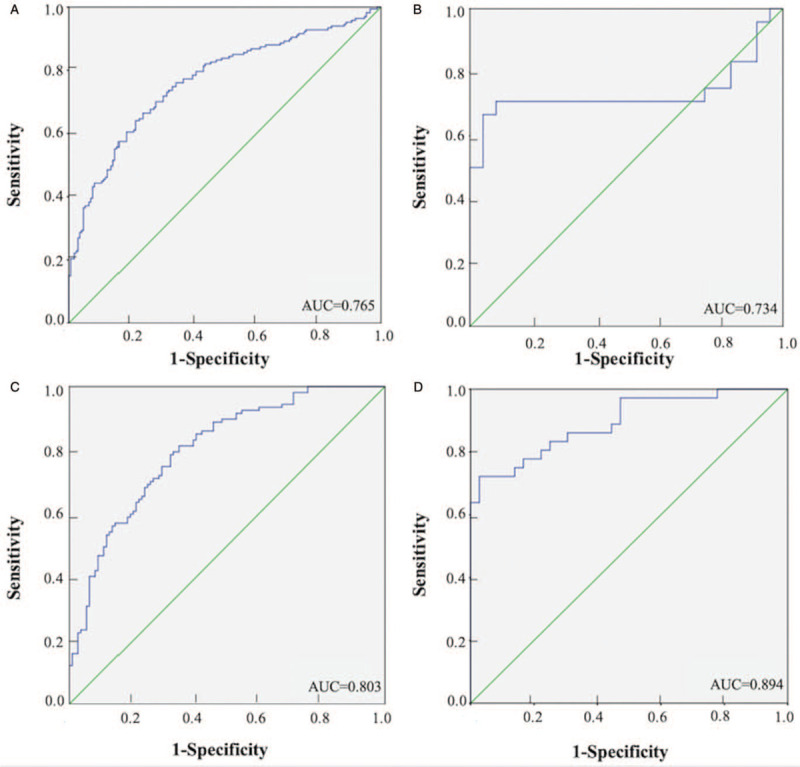
Receiver-operating characteristic (ROC) curves of the four-miRNA panel to discriminate lung adenocarcinoma (LA) patients from normal controls (NCs). (A): the combined three phases (170 LA vs. 170 NCs): AUC = 0.765, 95% CI: 0.714–0.816, P = 0.001; (B): the training phase (24 LA vs. 24 NCs): AUC = 0.734, 95% CI: 0.572–0.897, P = 0.002; (C): the testing phase (110 LA vs. 110 NCs): AUC = 0.803, 95% CI: 0.745–0.860, P < 0.001; (D): the external validation phase (36 LA vs. 36 NCs): AUC = 0.894, 95% CI: 0.882–0.967, P < 0.001.AUC: Areas under the curve; CI: Confidence interval; mi-RNA: MicroRNA.