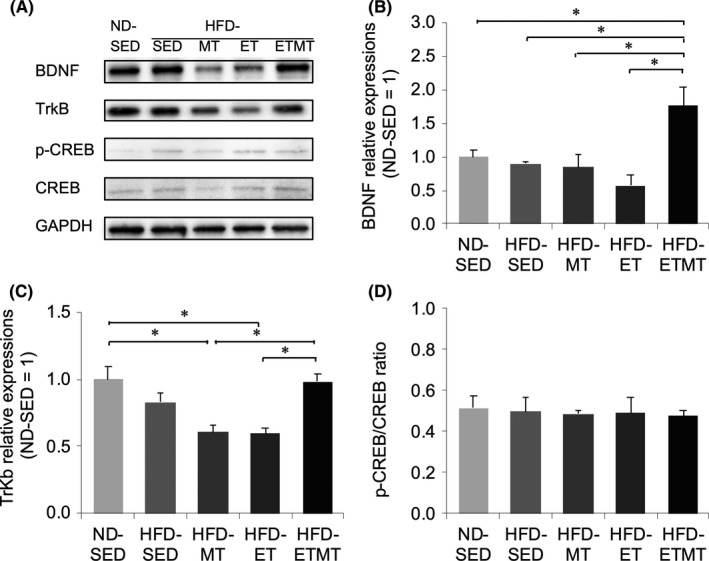
FIGURE 1.

The level of protein expression in the cerebellum following 9 wk of intervention. A, Representative band of BDNF, TrKB, CREB, phosphor‐CREB (p‐CREB), and GAPDH. Band intensities of (B) BDNF and (C) TrkB were normalized to those of GAPDH, and the value is expressed in relation to the value of HFD‐SED rats (set to 1). D, p‐CREB/CREB ratio. Data are presented as the mean ± SE (n = 4, each). *P < .05
