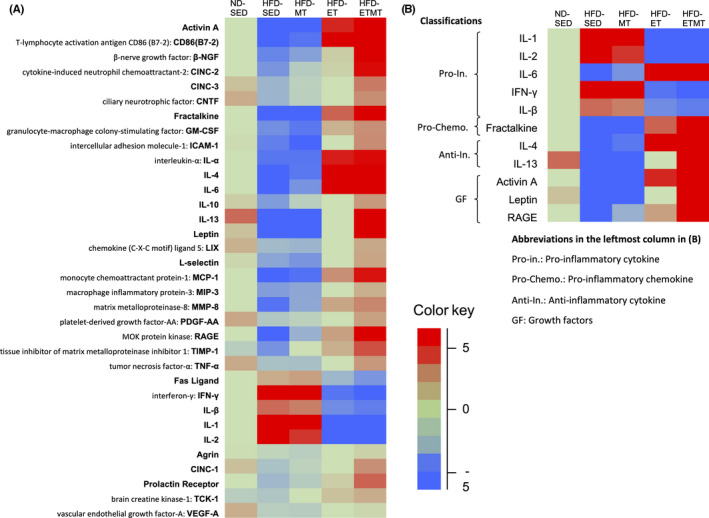
FIGURE 2.

Heat map of cytokine expression in the cerebellum following 9 wk of intervention. The relative expression levels (fold change) of each cytokine were determined by comparing the designated protein concentration of each sample relative to the median value of the designated cytokine across all samples. A, Heat map for all 34 cytokines, B, The cytokines displaying greater than twofold changes were selected in HFD‐SED rats. The images were shown in Figure S1. The color red indicates relatively high protein expression, and the color blue indicates relatively low protein expression
