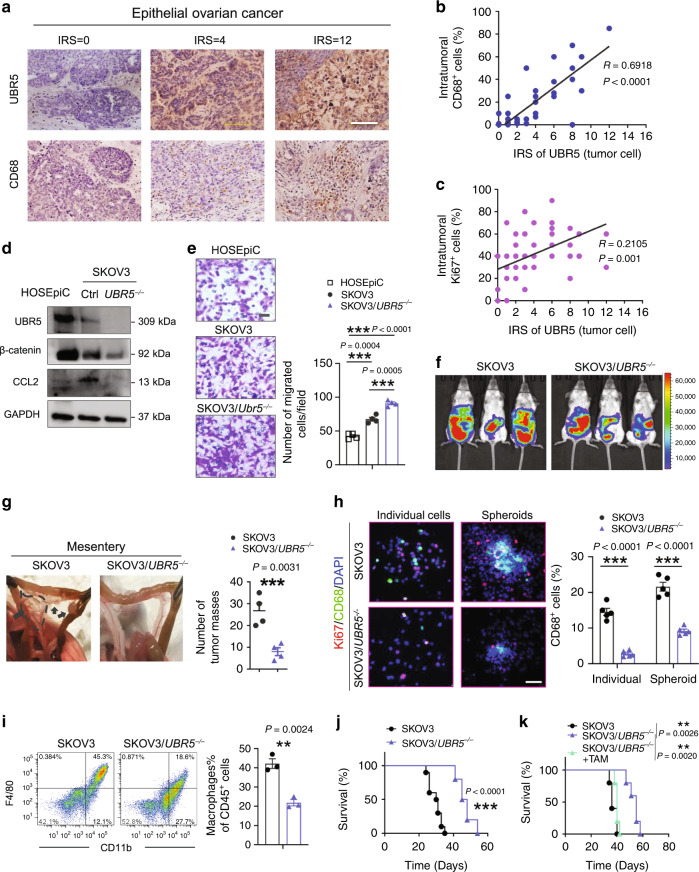
Fig. 7. Effects of human OC-derived UBR5 on TAMs and tumor growth.
a IHC staining of UBR5 and CD68 in primary tumors from OC patients (n = 50 samples). Scale bars: 200 μm. b, c Correlation assessed by Pearson correlation analysis and linear regression analysis between tumor UBR5 expression levels and intratumoral CD68+ (b), Ki67+ cell density (c) in human EOC patients (n = 50 samples). d Deletion of UBR5 in SKOV3 cells was verified by western blot. Reduced β-catenin and CCL2 expression in SKOV3/UBR5−/− were determined at protein level, human ovarian surface epithelial cells HOSEpiC were used as control. e Representative micrographs and quantitation of Transwell-migration assay for SKOV3 (n = 4 biologically independent samples per group and an average of five fields acquired from each sample). Scale bars: 50 μm. f On day 21 after tumor implantation, imaging with Luciferase in SKOV3 tumor bearing SCID/Beige mice (n = 3 mice per group). g Representative images and statistical analysis of tumor implantation in mesentery (n = 4 mice per group). h Representative images of CD68+ macrophages and surrounded Ki67+ cells from peritoneal washes (n = 4 mice per group and ten confocal images acquired from each sample). All panels are the same magnification, scale bars: 50 μm. i Representative FACS images and quantification of infiltrated CD11b+F4/80+ macrophages in peritoneal cavity (n = 3 mice per group). j Kaplan–Meier curves showing the survival of SKOV3 tumor-bearing mice (n = 10 mice per group). P < 0.0001, log-rank test. k Survival in mice bearing SKOV3/UBR5−/− with or without TAMs isolated from SKOV3 bearing donor mice were quantified (n = 5 mice per group), log-rank test. In all cases, data are representative of two independent experiments. Data are presented as mean ± SEM, unpaired two-sided Student’s t-test with no correction for multiple comparison, **P < 0.01, ***P < 0.001. Source data are provided as a Source Data file.

