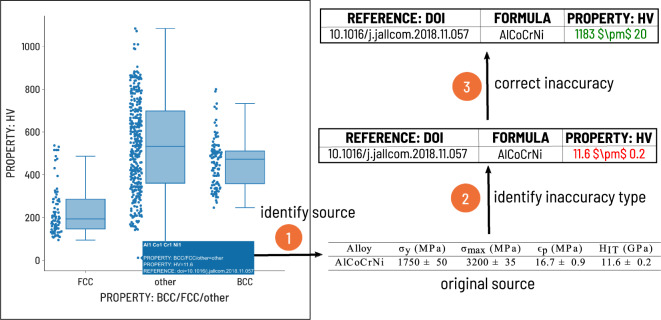
Fig. 4.
Workflow associated with extreme property value verification and (if necessary) correction. Step 1: Box plots were generated for properties of interest (e.g. alloy hardness) and the source of any extreme values were investigated. Step 2: In this case, the inaccuracy was units-related; the value was recorded as in units of GPa, however the database expected units of HV. Step 3: The value with correct units was updated in place of the originally recorded value. Original source reproduced with data from Jumaev et al.26.

