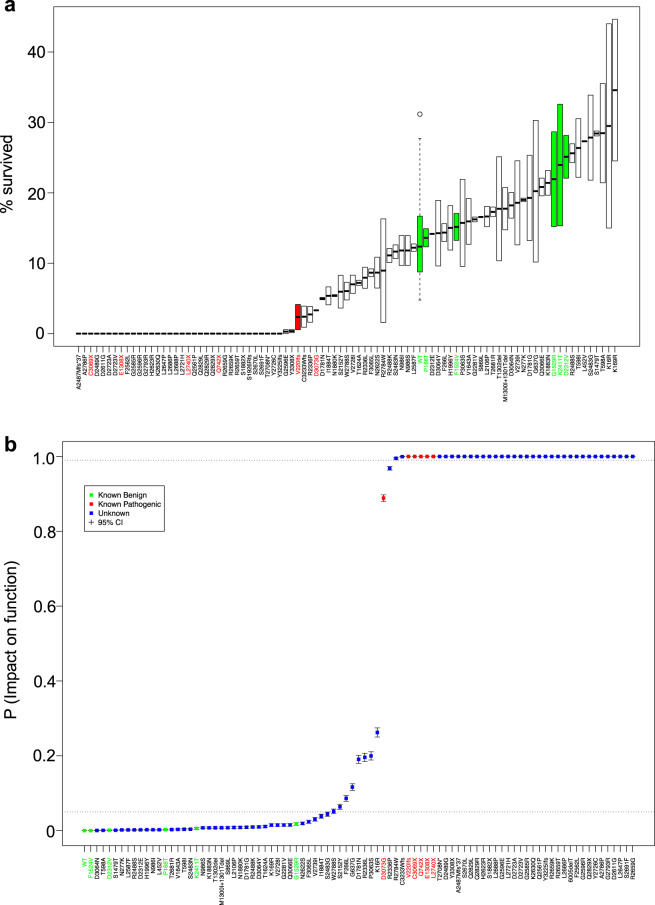
Fig. 2. Probability of impact on function (PIF) estimates of cell survival.
a Cell survival fractions are plotted for each variant ordered by average survival fraction. Known neutral variants are highlighted in green and known pathogenic variants are highlighted in red. The box plotted for each variant range from the lower replicate value up to the upper replicate value with the mean value highlighted at the midpoint; for the WT we have plotted a box and whisker plot of the distribution of WT values across batches (the box ranges from the first-to-third quartile with a horizontal line plotted at the median, whiskers extend from the box down to the smallest value and from the box up to the largest value within ±1.5 standard deviations of the median and points beyond this limit are depicted individually). b A plot of the estimated PIFs from the cell survival data VarCall model, depicted in increasing order. Posterior mean estimates are plotted as dots; whiskers extend from the lower to upper limits of 95% posterior credible intervals.

