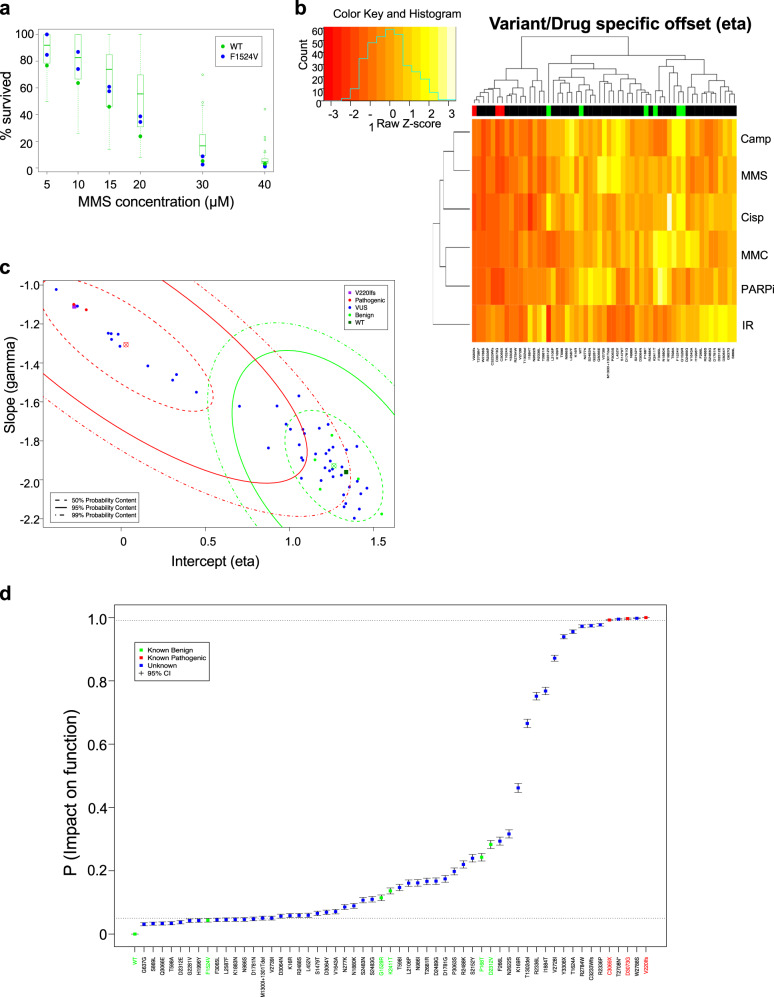
Fig. 3. The drug sensitivity data and probability of impact on function (PIF) estimates.
a A plot of the observed MMS assay survival fractions for variant F1524V (blue points); paired wildtype values are plotted as green points and the distributions of WT values across batches are depicted as boxplots (open circles represent outlier values). Note the characteristic nonlinear decline in survival fraction from 1.0 (100%) to zero as a function of concentration. This relationship is modeled well using the chosen family of dose response curves. b Bi-clustered heatmaps of the drug sensitivity model intercept parameters from the drug sensitivity model. Cells in the plot represent variant- (column) and drug-specific (row) effects. Higher survival percentage values are plotted in shades of yellow; lower values in shades of red and orange. The lower the value of eta, the faster the survival fractions decline as a function of dose, i.e., the greater the sensitivity of the variant. Variants tend to co-cluster as likely pathogenic or likely neutral based on these estimates (the green and red bars at the top of the plot indicate the known benign and known pathogenic variants, respectively). c Slope vs. intercept scatter plot of the estimated variant-level drug sensitivity effects for each variant. Contours of the bivariate VarCall mixture model components are plotted in green (neutral component) and red (pathogenic). Variants plotted at similar contour levels for both components will have equivocal PIF estimates; variants plotted at dissimilar levels (e.g., those in the upper left corner) will be more clearly classified (see panel d). d Estimated PIFs plot from the drug sensitivity data VarCall model, depicted in increasing order. Dots represent posterior mean estimates with the whiskers extend from the lower to upper limits of 95% posterior credible intervals.

