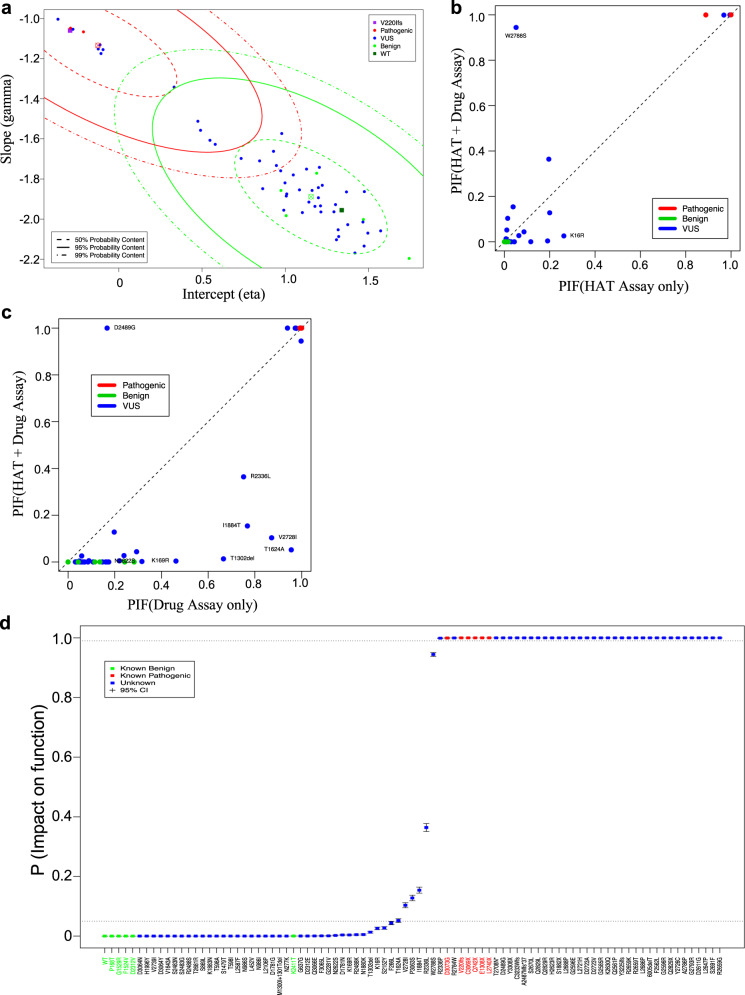
Fig. 4. Classification parameters and estimates from the model combining the cell survival and drug sensitivity data.
a Slope vs. intercept scatter plot for the combined model. b Plot of the PIF from the HAT model (x-axis) against the PIF from the combined model (y-axis). c Plot of the PIF from the drug assay model (x-axis) against the PIF from the combined model (y-axis). d Plot showing the estimated PIFs plot from the combined VarCall model of HAT survival and drug sensitivity data, depicted in increasing order. Posterior mean estimates and represented as dots and the whiskers extend from the lower to upper limits of 95% posterior credible intervals.

