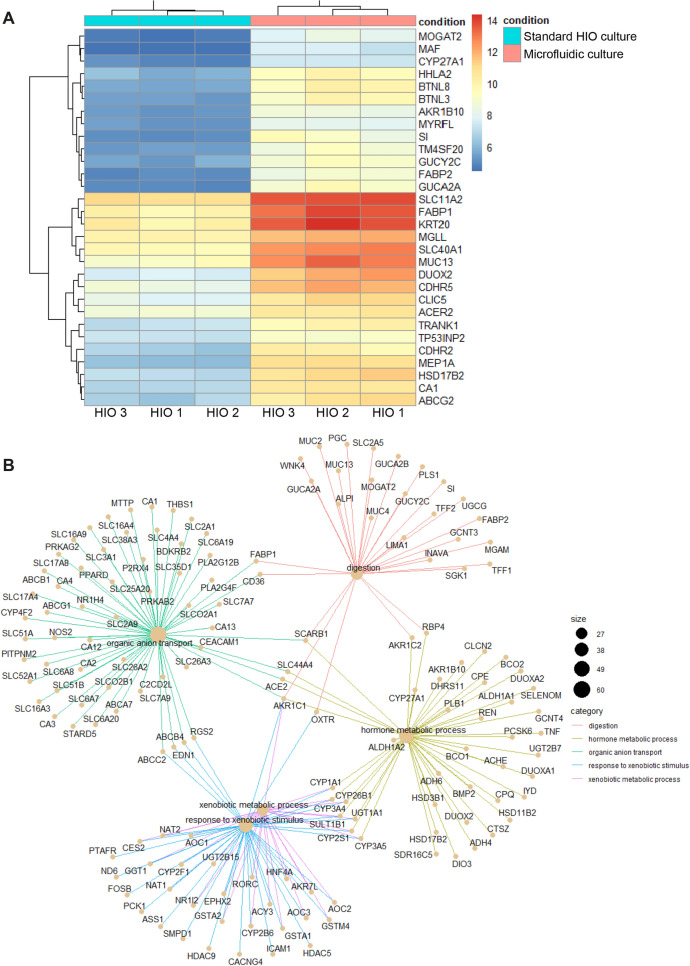
Figure 2.
IEC cultured under microfluidic conditions show higher expression of genes involved in digestion, intestinal transport and hormone metabolic process. (A) Heatmap representation of the top 30 differentially expressed genes between standard and microfluidic HIO culture in three HIO donors. Higher levels of expression are represented in red and lower levels in blue. (B) Differentially-expressed genes between standard and microfluidic HIO culture were grouped under Gene ontology (GO) functional pathways. Circle size represents the number of genes differentially expressed in each GO pathway and lines link individual genes to their related GO pathways.

