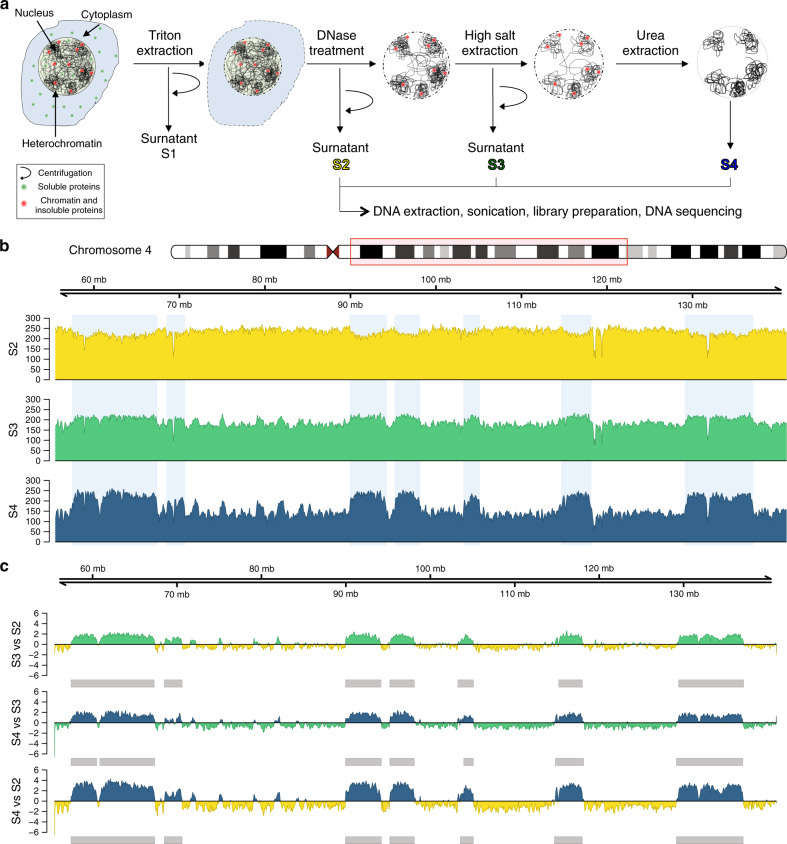
Fig. 1. SAMMY-seq isolates specific DNA regions in fibroblast samples.
a Schematic representation of SAMMY-seq. Chromatin fractions are sequentially isolated after DNase treatment, high salt, and urea buffers extractions. The associated genomic DNA is extracted, sonicated, and processed for high-throughput sequencing. b Distribution of SAMMY-seq reads along a representative region (85 Mb region in chr4:55480346-141005766). Library size normalized read counts over 10 kb genomic bins are shown for each sequenced fraction of a control fibroblast sample (CTRL002) at passage 20. c Differential reads distribution across pairwise comparisons of SAMMY-seq fractions in a control fibroblast sample (CTRL002) along the genomic region in b. Less accessible fractions are compared to more accessible ones used as reference (S3 vs S2; S4 vs S3; S4 vs S2). Regions of signal enrichment (green or blue) or depletion (yellow or green) over the reference samples are shown. The smoothed differential signal is calculated with SPP, and significantly enriched regions (SAMMY-seq domains) are called with EDD and reported as gray boxes under the enrichment signal track.

