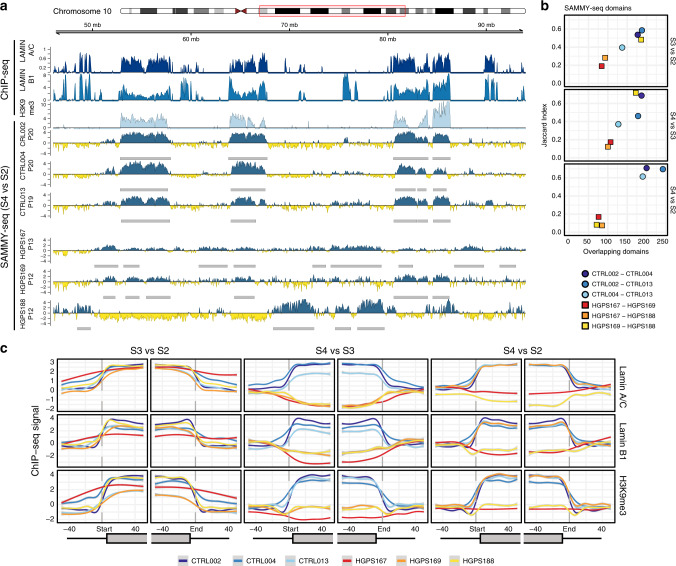
Fig. 3. HGPS fibroblasts show early changes in chromatin accessibility.
a Genomic tracks for SAMMY-seq in three control and three HGPS samples at indicated passages (p12-20) along with chromatin marks in a representative region (48 Mb region in chr10:46000000-94000000). From top to bottom: tracks for the association to lamina (Lamin A/C and Lamin B1 ChIP-seq – dark blue and blue); heterochromatin (H3K9me3 ChIP-seq – light blue); SAMMY-seq enrichment signal (S4 vs S2) in three control and three HGPS samples (blue or yellow-colored track for enrichment or depletion, respectively, over the S2 reference baseline). Gray boxes under each SAMMY-seq track show the SAMMY-seq domains. For ChIP-seq data, the (ChIP – input) reads distribution was computed with SPP package and we are limiting the y axis range to zero as a minimum value. b Pairwise overlap of SAMMY-seq domains (S3 vs S2, S4 vs S3, S4 vs S2) between control or HGPS sample pairs (JI on y axis, number of overlapping regions on x axis). Upper-tail Fisher test p-value < 0.01 for all overlaps, except for HGPS S4 vs S2 pairwise overlaps. c Smoothed average ChIP-seq enrichment signal for chromatin marks around SAMMY-seq domain borders. ChIP-seq signal for Lamin A/C (upper row), Lamin B1 (middle row), and H3K9me3 (bottom row) is reported around the SAMMY-seq domain borders start (left side plots) or end (right side plots) for domains detected in each control and progeria sample. Results for each set of SAMMY-seq enrichment domains are reported (S3 vs S2 on the left, S4 vs S3 center, S4 vs S2 on the right) using a ±50 bins window (10 kb bin size) centered on the start or end domain border positions (vertical dashed gray line). The smoothed average is obtained by GAM (see “Methods” section) and the gray shaded area under each line shows the 95% confidence interval for the fitted GAM.

