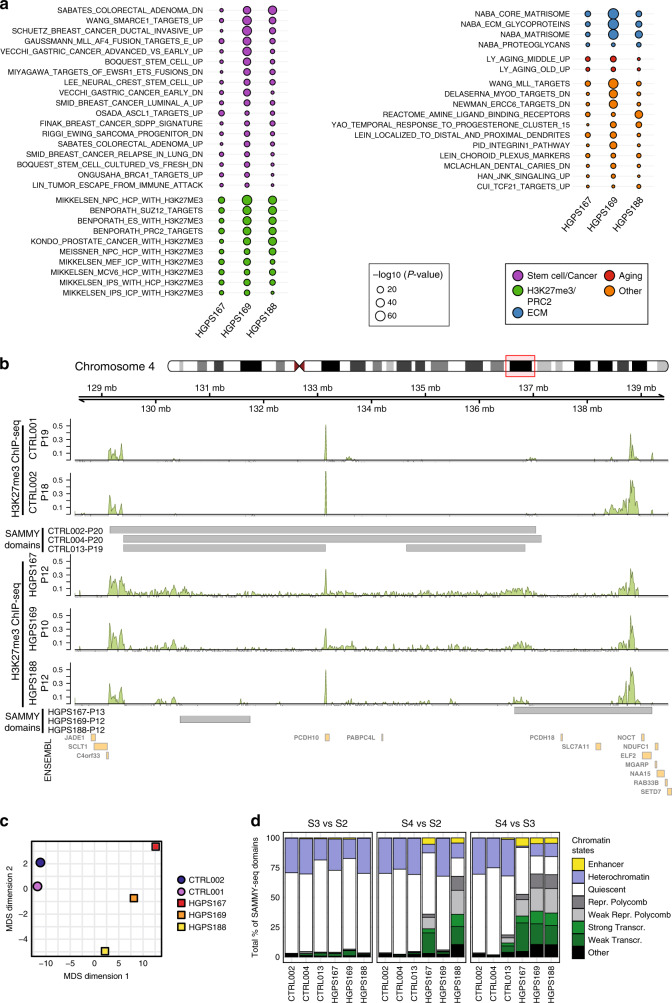
Fig. 5. HGPS fibroblasts show an alteration of PRC2 distribution.
a MSigDB pathways consistently deregulated (FDR < 0.05) in all three progeria samples, based on comparison of individual HGPS samples to the group of control samples. A two-sided Wald test was used to compute p-values for the differential expression at the transcript level, then uncorrected p-values were aggregated at pathway level using the Lancaster method, and Benjamini–Hochberg FDR correction applied on the aggregated p-values (see “Methods” section). Pathways are ranked based on the sum of their −log10 transformed p-values across all three progeria samples. Dot colors highlight different categories of pathways as per graphical legend: related to stem cells or cancer, H3K27me3/PRC2 regulation, extracellular matrix (ECM), aging, or other categories. Dot size is proportional to the −log10 transformed p-value. b Genomic track for H3K27me3 ChIP-seq signal in control and HGPS samples at indicated passages (p10-19) for a representative region (11 Mb region in chr4:128500000 to 139500000). Enrichment signals (computed using SPP) for each sample are shown. SAMMY-seq domains (S4 vs S2 comparison) are reported as gray rectangles for three controls and three HGPS samples, as indicated in the labels. For ChIP-seq data, the (ChIP – input) reads distribution was computed with SPP package and we are limiting the y axis range to zero as a minimum value. c Multi-dimensional scaling of H3K27me3 ChIP-seq experiments using read counts in 10k genomic regions across all autosomes. The 2D distance of dots is representative of the pairwise distance of samples using the 10k genomic region read counts. d Overlap of SAMMY-seq domains from each sample to Roadmap Epigenomics chromatin states for fibroblasts (E055). The overlaps with each chromatin state are reported as a percentage over the total of SAMMY-seq domains (S3 vs S2, S4 vs S2 or S4 vs S3) for each sample.

