Fig. 4.
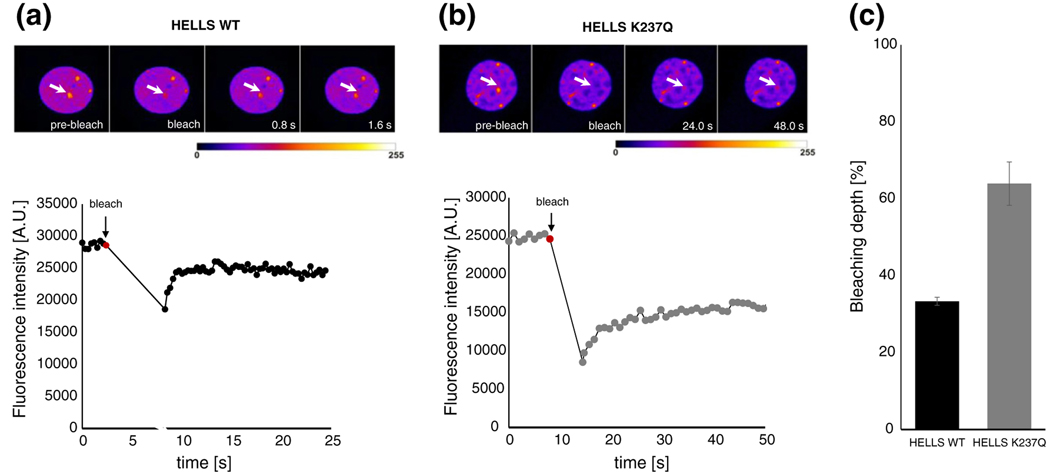
The wild-type and ATPase-deficient HELLS show different bleaching behaviors at pericentromeric heterochromatin. Representative time frames of exemplary FRAP series (pseudocolored) for the wild-type (a) and mutant HELLS (b). The arrows denote the circular area that was bleached and where the fluorescence intensity was monitored over time. Images were taken at the indicated time points after the bleach pulse. In the lower half of the graph, the fluorescence intensity of the measured area was plotted as a function of time. Every point of the curve represents data stemming from single images recorded with a period of 0.3 and 1.0 s for wild-type and mutant transfected cells, respectively. The bleaching start point was correspondingly annotated (red point). (c) The average bleaching depth observed for wild-type and mutant HELLS transfected cells. Error bars represent standard error of the mean, based on measurements performed on 9 cells for wild-type HELLS and on 11 cells for the mutant protein.

