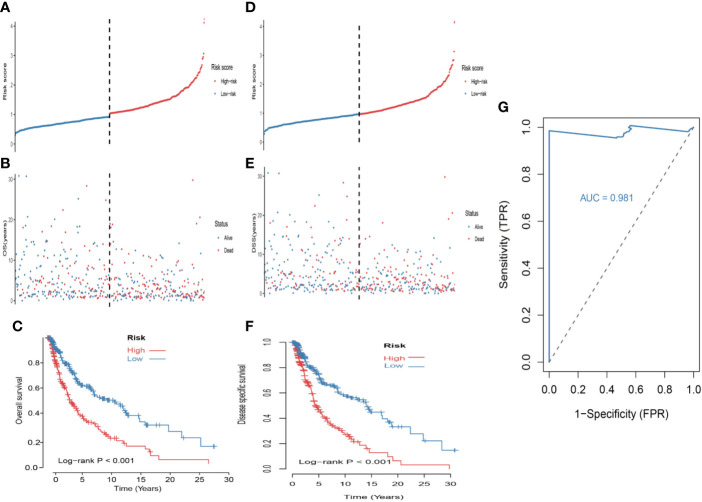
Figure 4.
Construction of the 5-MRGs signature in the TCGA set for predicting melanoma patients’ overall survival (OS) and disease specific survival (DSS). (A) The distribution of risk score for OS. The risk scores are arranged in ascending order from left to right. (B) OS and life status of melanoma patients. (C) The TCGA dataset was subjected to Kaplan–Meier analysis to compare OS between patients in the high risk group and those in the low risk group. (D) The distribution of risk score for DSS. (E) DSS and life status of melanoma patients. (F) The TCGA dataset was subjected to Kaplan–Meier analysis to compare DSS between patients in the high risk group and those in the low risk group. (G) The receiver operating characteristic (ROC) curves of 5-MRGs biomarker in 3 years.

