-
A
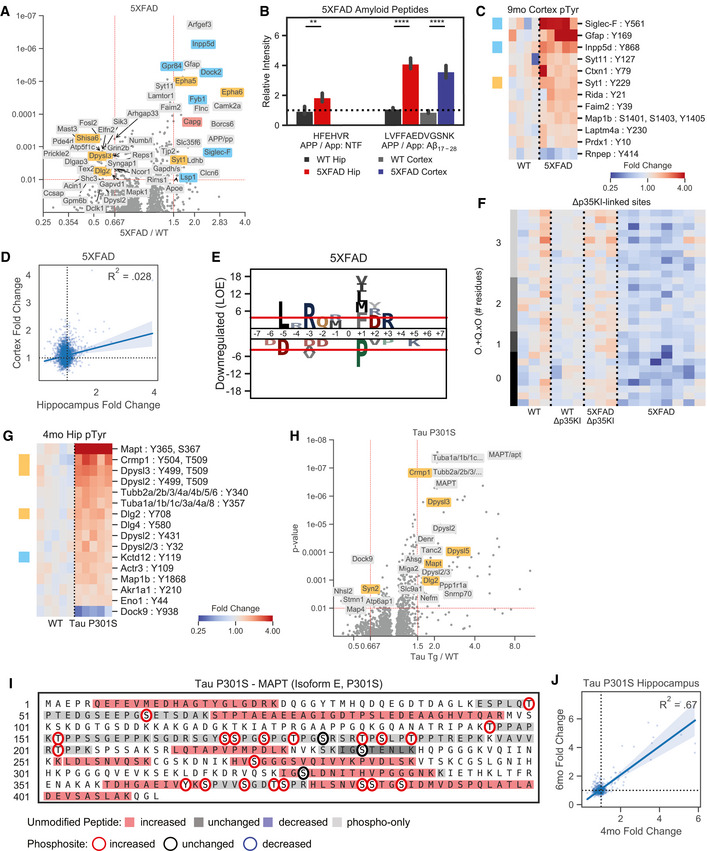
Volcano plots showing changed phosphopeptides in 5XFAD animals. All tissues and time points are considered together for fold change and p‐value calculations. Protein names are shown for changed peptides. Labels are only shown for peptides with maximum directional change from each protein. Labels are colored by predicted cell=type specific protein. Orange–Neuron, Blue = Microglia, Salmon = Endothelia.
-
B
Quantification of transgenic amyloid precursor protein peptides identified in the hippocampus and cortex from 5XFAD and WT mice: HFEHVR and LVFFAEDVGSNK. APP / App indicates peptides mapped to both transgenic and native protein. NTF: N‐terminal Fragment, Aβn‐m: peptide mapped within A.
-
C
Heatmap showing enriched phosphotyrosine peptides in the cortex of 9 mo 5XFAD mice. Colors indicate fold change relative to control animals on a log2-scale. Row colors (left) indicate peptides from predicted cell-type specific proteins using the same scheme as (A).
-
D
Correlation between phosphopeptide fold changes in the hippocampus and cortex of 9mo 5XFAD mice. Linear regression R2 value is shown on plot.
-
E
Phosphorylation motif logos for enriched peptides from the downregulated (FC < .8, p < 1e‐2) pSer/pThr phosphoproteome of 5XFAD mice. Y‐axis shows log‐odds enrichment (LOE) of amino acids proximal to phosphorylation sites.
-
F
Phosphopeptides associated with Δp35KI mutation in 5XFAD mice. Heatmap colors indicate log2 fold changes from hippocampus tissue. Row colors (left) indicate the number of residue positions for which peptides match the CaMKII motif: O.+Q.xO ‐, where ‘O’ indicates hydrophobic residues (FLMVI), ‘+’ indicates positively charged residues (KR), ‘×’ indicates a phosphosite, and ‘.’ indicates any residue. ‘×’ and ‘.’ are uncounted for motif scores.
-
G
Volcano plots showing changed phosphopeptides in Tau P301S mice. All tissues and time points are considered together for fold change and p‐value calculations. Protein names are shown for changed peptides. Labels are only shown for peptides with maximum directional change from each protein. Labels are colored by predicted cell‐type specific protein. Orange = Neuron, Blue = Microglia.
-
H
Heatmap showing enriched phosphotyrosine peptides in Tau P301S 4mo hippocampus tissues. Colors indicate fold change relative to control animals on a log2‐scale. Row colors (left) indicate peptides from predicted cell‐type specific proteins using the same scheme as (A).
-
I
Transgenic MAPT peptides identified in Tau P301S mice. Colored bars indicate directional changes for non‐phosphorylated peptides. Red = increased, blue = decreased, grey = unchanged, light‐grey = only phosphopeptides were seen in that region. Colored circles indicate phosphorylation sites that were quantified. Red circle = increased, blue circle = decreased, black circle = unchanged.
-
J
Correlation between phosphopeptide fold changes in hippocampus tissues of 4mo and 6mo Tau P301S mice. Linear regression R2 value is shown on plot.

