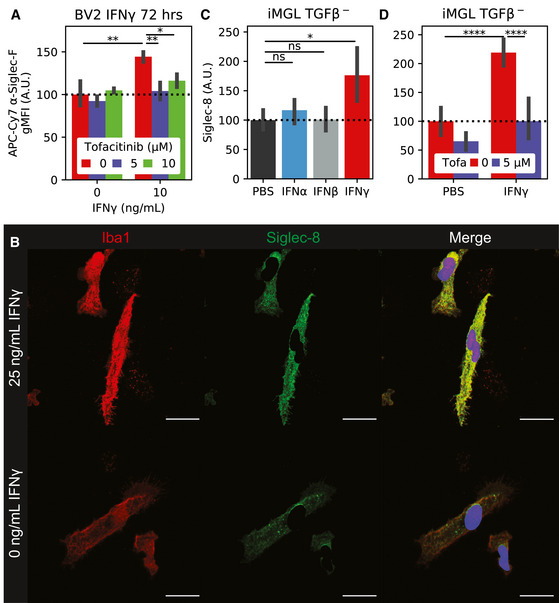
Flow cytometry quantification of BV‐2 Siglec‐F expression levels. Cells were co‐treated with 0‐10 ng/ml IFNγ and 0‐10 μM tofacitinib. Values are geometric mean fluorescence intensities (gMFI). Bars indicate mean ± 95% CI; n = 2‐4 replicates; *P < 5e‐2, **P < 1e‐2, ***P < 1e‐3, ****P < 1e‐4; ns: not significant, using unpaired Student’s t‐test, two‐sided. Dotted line indicates mean of untreated group.
IF staining of iMGLs treated with IFNγ. Siglec‐8 fluorescence is only shown on non‐nuclear (Hoechst 33342‐) regions. Images are 60× super‐resolution max z‐stack projections. Colors are as follows: Red = Iba1, Green = Siglec‐8, Blue = 33342. Scale bars = 20 μm.
Quantification of Siglec‐8 on iMGLs treated with PBS or 25 ng/ml IFNα, IFNβ, or IFNγ. Values are mean Siglec‐8 intensity values from Iba1+;33342‐ regions. Bars indicate mean ± 95% CI; n = 8 images (2 replicates); *P < 5e‐2, **P < 1e‐2, ***P < 1e‐3, ****P < 1e‐4; ns: not significant, using unpaired Student’s t‐test, two‐sided. Dotted line indicates mean of untreated group.
Quantification of Siglec‐8 on iMGLs treated ± 25 ng/ml IFNγ and 5 μM tofacitinib. Legend is same as (C). Bars indicate mean ± 95% CI; n = 5‐20 images (2 replicates); *P < 5e‐2, **P < 1e‐2, ***P < 1e‐3, ****P < 1e‐4; ns: not significant, using unpaired Student’s t‐test, two‐sided. Dotted line indicates mean of untreated group.

