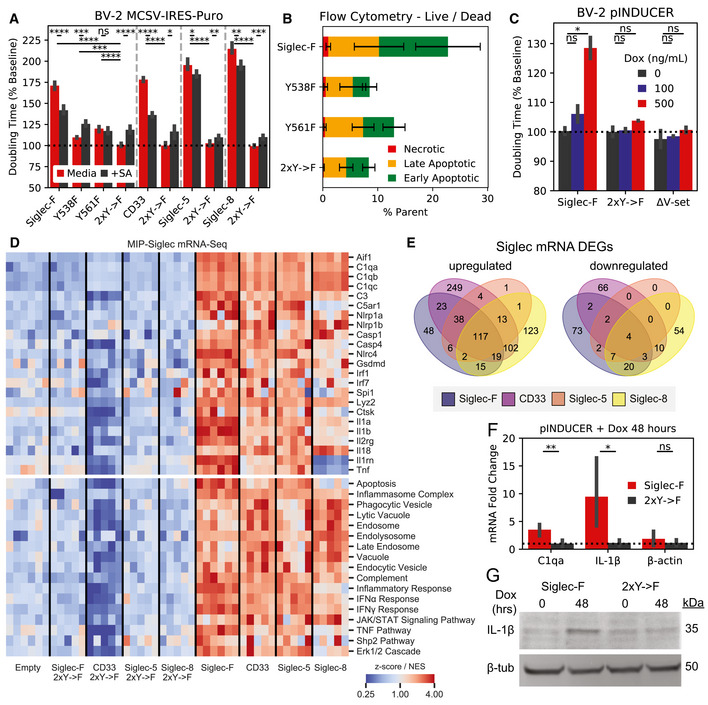
Confluency doubling times quantified from BV‐2 cells with stable retroviral expression of Siglec‐F and related human Siglec constructs. Plots indicating doubling time (normalized to 2xY‐>F constructs) estimated from Incucyte brightfield images. Cells grown in media alone or + 50 mU sialidase (+SA). Bars indicate mean ± 95% CI; n = 3‐12 replicates; *P < 5e‐2, **P < 1e‐2, ***P < 1e‐3, ****P < 1e‐4; ns: not significant, using unpaired Student’s t‐test, two‐sided. Dotted line indicates mean of 2xY‐>F groups.
Flow cytometry quantification of cell live/ dead markers Annexin‐V and propidium iodide on BV‐2 cells with stable retrovirus expression of Siglec‐F constructs. % parent values are shown for early apoptotic (Annexin‐V+;PI–), late apoptotic (Annexin‐V+;PI–), and necrotic (Annexin‐V–;PI+) populations. Bars indicate mean ± SD; n = 8 replicates.
Confluency doubling times quantified from BV‐2 cells with dox‐inducible expression of Siglec‐F constructs. Plots indicating doubling time (normalized to 2xY‐>F constructs) estimated from Incucyte brightfield images. Bars indicate mean ± SD; n = 8 replicates; *P < 5e‐2, **P < 1e‐2, ***P < 1e‐3, ****P < 1e‐4; ns: not significant, using unpaired Student’s t‐test, two‐sided. Dotted line indicates mean of 2xY‐>F group.
Selected gene expression changes (top) and enriched gene sets (bottom) taken from RNA‐seq analysis of BV‐2 cells with stable retroviral expression of Siglec constructs, 2xY‐>F, and empty vector controls. Heatmaps share a color map range of 0.25 to 4 for z‐score values (top), normalized enrichment scores (NES, bottom).
Quantification and overlap of differentially expressed genes (DEGs) between each Siglec‐expressing BV‐2 cell line. DEGs were calculated for each Siglec gene compared to respective 2xY‐>F mutants (upregulated P < 1e‐8, FC> 1.5; downregulated P < 1e‐8, FC < 0.66).
Expression levels of C1qa, IL‐1β, and β‐actin by qPCR analysis in BV‐2 cells with inducible Siglec‐F expression after 48 h of treatment with 500 ng/ml doxycycline. Fold Change values are equal to normalized relative to GADPH mRNA levels. Bars indicate mean ± 95% CI; n = 6 replicates; *P < 5e‐2, **P < 1e‐2, ***P < 1e‐3, ****P < 1e‐4; ns: not significant, using unpaired Student’s t‐test, two‐sided. Dotted line indicates mean of 2xY‐>F group.
Western blot showing pro‐IL‐1β and β‐tubulin in BV‐2 cells induced to express Siglec‐F at 0 and 48 h.

