-
A
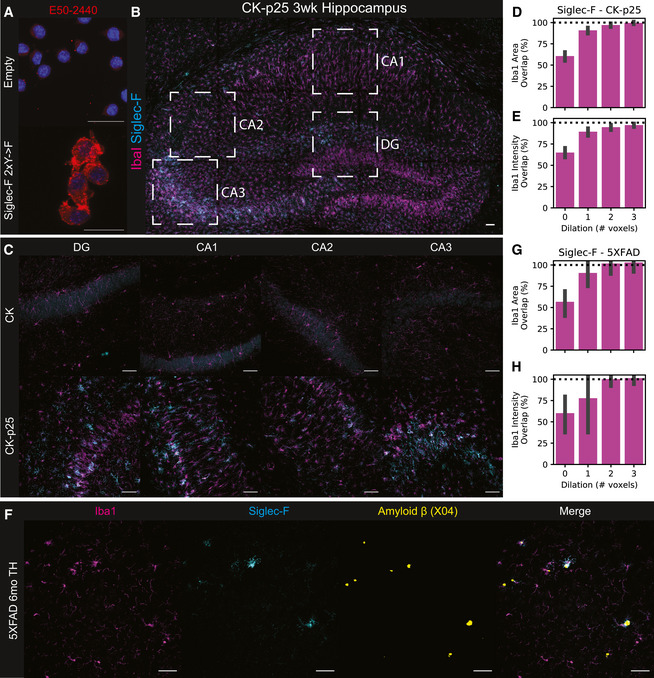
Validation of E50‐2440 antibody on BV‐2 with stable Siglec‐F expression. Top: Empty vector; Bottom: Siglec‐F 2×Y‐>F. Blue = 33342, Red = E50‐2440. Scale bars = 20 m.
-
B
Immunofluorescence (IF) staining showing Siglec‐F and Iba1 localization in CK‐p25 3wk hippocampus tile scan view. Boxed regions indicate analyzed regions: DG, CA1, CA2, and CA3. Scale bars = 50 μm. Colors are: Magenta = Iba1, Cyan = Siglec‐F. Images are max z‐stack projections taken from coronal slices.
-
C
Individual wide‐field images of DG, CA1, CA2, and CA3 regions from CK (top) and CK-p25 mice (bottom).
-
D–E
Percent of total Siglec‐F mask (D) area and (E) signal intensity that overlaps with Iba1 masks that have been dilated by a variable number of pixels. ° indicates Iba1 mask was dilated prior to Boolean overlap calculation. 1 voxel 2.4 μm. Values are calculated from CA1, CA2, CA3, and DG image regions from CK‐p25 animals using the same image set as Figure 1C.
-
F
Wide‐field image of Siglec‐F, Iba1, and Aβ (Methoxy X04) signal across in the thalamus (TH) of 6 m.o. 5XFAD mice.
-
G–H
Percent of total Siglec‐F mask (G) area and (H) signal intensity that overlaps with Iba1 masks that have been dilated by a variable number of pixels. Legend is same as (D‐E). Values are calculated from thalamic, cortical, and hippocampal regions from 5XFAD animals using the same image set as Figure 2F.

