-
A
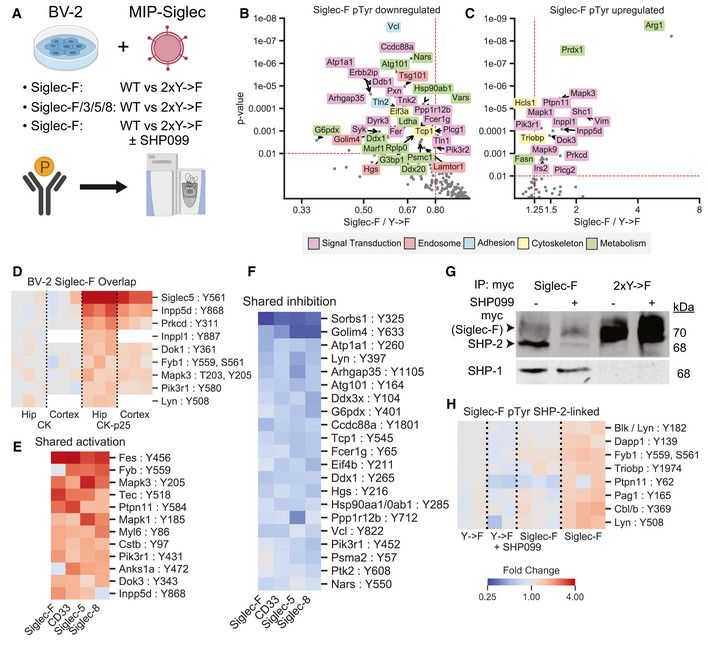
Experimental design for phosphotyrosine analysis of BV‐2 cells with stable expression of Siglec and corresponding 2xY‐>F mutants. Samples were run as three 10‐plex experiments: (1) Siglec‐F: WT vs. 2xY‐>F; (2) Siglec‐F, CD33, Siglec‐5, and Siglec‐8: WT vs 2xY‐>F; (3) Siglec‐F: WT vs. 2xY‐>F ± 1 μM SHP099. Phosphotyrosine peptides were enriched and analyzed by LC‐MS/MS.
-
B, C
Volcano plots showing phosphotyrosine peptides that were (B) increased or (C) decreased after Siglec‐F expression. Plots show Siglec‐F compared to 2xY‐>F mutant data integrated across all three runs. Protein names are shown for altered peptides. Labels are only shown for peptides with maximum directional change from each protein. Labels colored according to GO terms: magenta = signal transduction, red = endosome, cyan = cell adhesion, yellow = cytoskeleton, green = metabolism.
-
D
Heatmap showing phosphosites in CK‐p25 which overlapped in their directional change with BV‐2 Siglec‐F‐associated sites. Colors indicate fold change relative to 2xY‐>F controls.
-
E, F
Heatmap showing phosphosites from CD33, Siglec‐5, and Siglec‐8 overexpression that were (E) increased or (F) decreased with Siglec expression and shared their directional change with Siglec‐F. Siglec‐F column indicates average of all untreated Siglec‐F replicates. Color scale is same as (D).
-
G
Western blot quantification of myc, SHP‐2, and SHP‐1 from myc co‐IP eluates. Co‐IP lysates were prepared from BV‐2 cells stably expressing Siglec‐F and optionally treated with 1 μM SHP099.
-
H
Heatmap showing phosphosites that were perturbed by SHP099 treatment. Color scale is same as (D).

