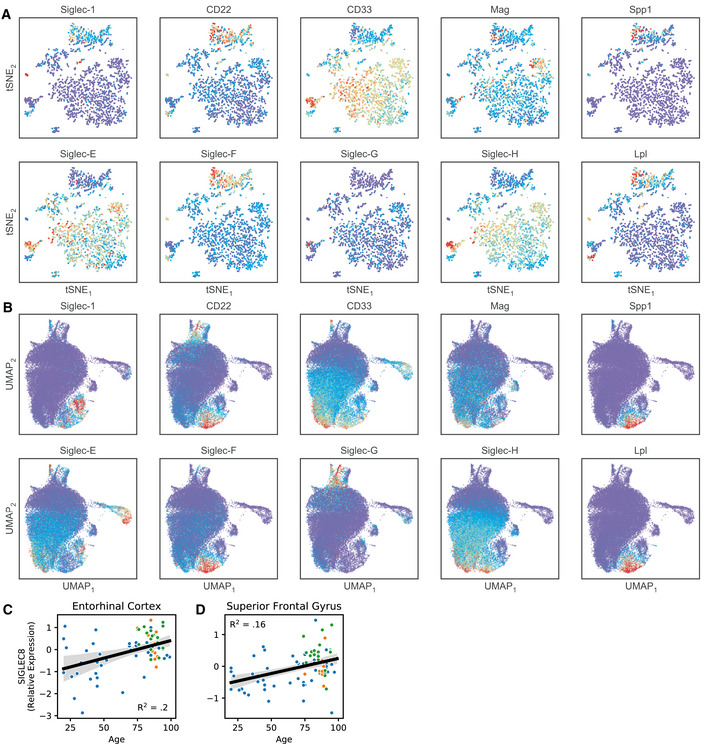
Figure EV5. Siglec expression patterns in microglial scRNA‐Seq and bulk RNA‐seq datasets.

-
AReanalysis of Siglec expression patterns in CK‐p25 microglia. Expression levels were imputing using MAGIC and plotted using the tSNE coordinates from the original publication. Late response MHC‐II+ microglia (top cluster, marker genes: Spp1, Lpl) show increased Siglec‐F expression compared with homeostatic microglia (lower right cluster).
-
BReanalysis of Siglec expression patterns in 5XFAD microglia. Expression levels were projected onto two dimensions using UMAP and imputed using MAGIC. Disease‐associated microglia (lower center, marker genes: Spp1, Lpl) show increased Siglec‐F expression compared with homeostatic microglia (center).
-
C–DRelative RNA abundances for Siglec‐8 in (C) entorhinal cortex and (D) superior frontal gyrus post‐mortem patient tissue. Blue = ND; Yellow = MCI; Green = AD. Linear regression R2 and p‐values are shown on plots.
