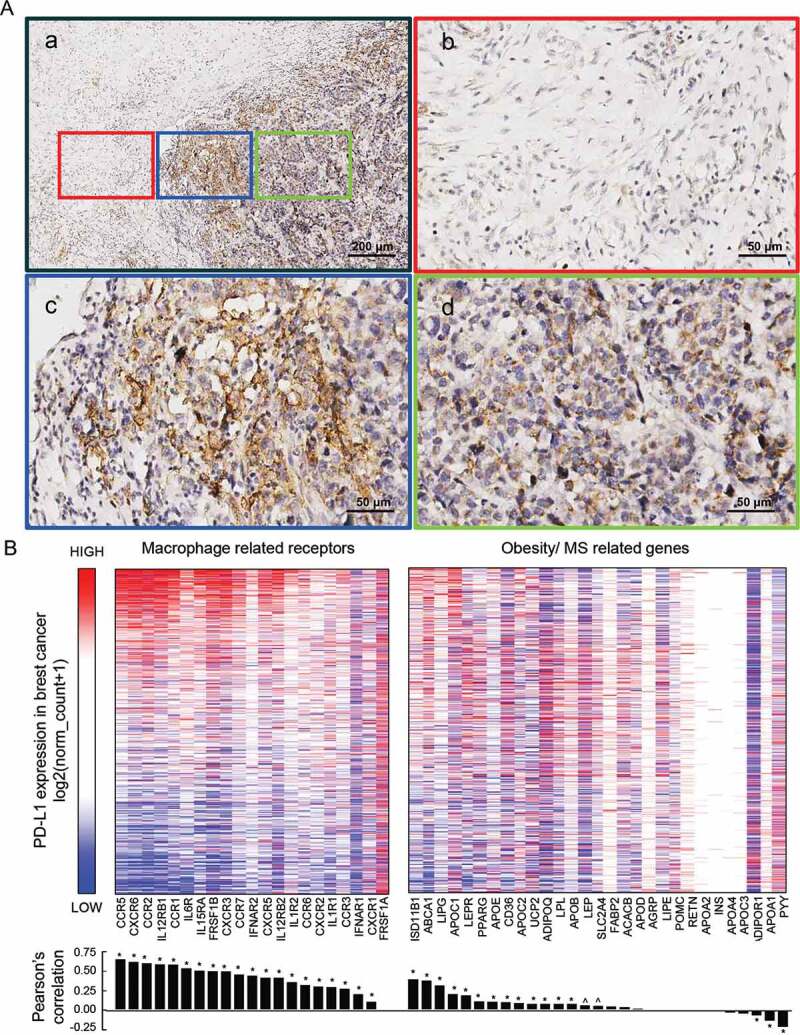
Figure 2.

IHC staining of PD-L1 in TNBC specimen, and the relationship of PD-L1 expression with macrophage-derived cytokine corresponding receptors and with obesity/MS promoting genes in TCGA breast dataset
(A-a), PD-L1 expression at the edge of TNBC specimen. (A-b, c, d), Images which are in red, blue, and green frames are, respectively, representative part of mesenchyme tissue, tumor edge, and tumor inner tissue captured from (A-a). (B), The correlations heatmap of expression of macrophage-related receptors and obesity/MS-related genes with their PD-L1 expression counterpart in breast cancer samples. The expression data were downloaded from the UCSC Xena database and shown by log2(norm_count+1). Color red represents high expression and blue represents low. The receptors and genes were arranged by the order of their Pearson’s correlation coefficients, which are shown by bar graph below the heatmap, between them and PD-L1 expression. Symbols * and ^ represent statistically significant (P < .01 and P < .05, respectively).
